The wholesale economic problem widened again in October, even as the Commerce Dept. reported yesterday wholesale inventories rose at the slowest pace in two years. Overall, non-adjusted inventories rose by 3.6% compared to October 2014, which was less than half the rate of the summer of 2014. But that slowing inventory (which is still GDP negative in the second derivative terms) pales in comparison to the continued and outright contraction on the sales side. Total wholesale sales fell by almost 6% in October Y/Y, making for the second worst month in sales of this “cycle”, beaten only by -6.9% in May. At -5.8%, October is worse than every month of the dot-com recession and its aftermath.
It bears repeating and emphasizing that there is no clear reason for this divergence, and certainly not for it to continue as long as it has. There is no historical precedence for this outcome, leaving suspicion to reasonably fall upon Janet Yellen’s continued recovery insistence – even though the opposite is the actual and continuing condition.
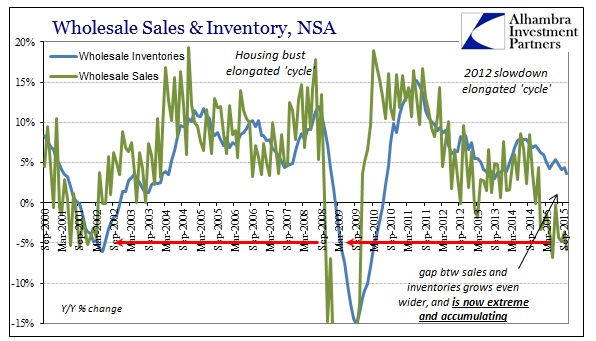
As you can see plainly above, inventory and sales are almost always very closely correlated which is just common sense. Any deviations, and sales always leads inventory, are temporary as inventories follow with some relative lag. These gaps are clustered around recessions and the recoveries that follow. When wholesale sales turned negative in February 2001, just as the dot-com recession was to begin, inventories did so seven months later toward the tail end of it. On the other side, into the recovery, sales turned positive in July 2002 while inventories followed quickly that December.
In the second part of the Great Recession, wholesale sales collapsed first in November 2008, leading inventories by just 3 months. After the recession ended, sales turned positive in November 2009 and inventories doing the same by July 2010.
In both of those cycles, the longest lag between sales and inventory was the eight months it took for sales to initiate the recovery’s restocking after the Great Recession. As it was, wholesale sales declined only for thirteen months total (though the scale of those declines was enormous). Wholesale sales turned negative last November, meaning that sales have contracted for a full year already and inventories are still growing by nearly 4%, only gently decelerating so far. That has produced a sales gap that is comparable only to the second phase of the Great Recession.
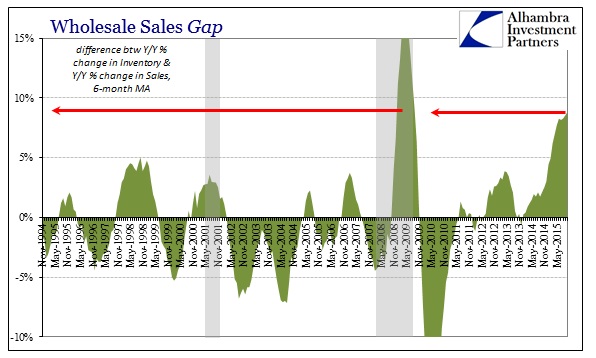
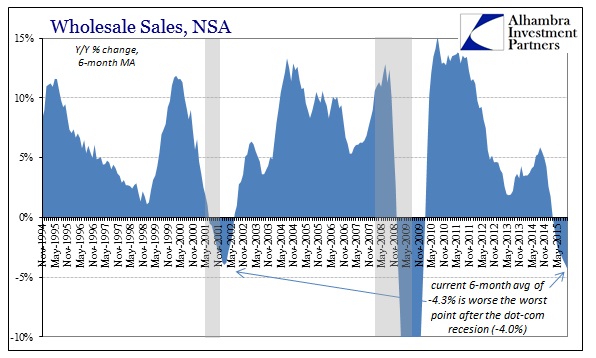
In terms of the scale of the decline, again, the current contraction is already slightly deeper and significantly longer than the whole of the dot-com recession. Not only is October’s contraction worse than any month in that past event, the 6-month average now is lower than the worst point registered in the economic aftermath of 2002.
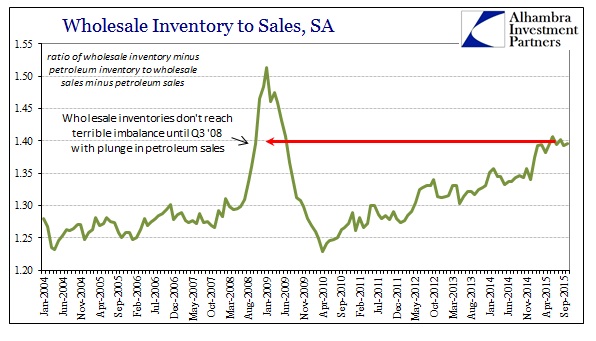
To which convention replies at energy and oil. Undoubtedly, the oil crash is playing some role in the distortion, but oil prices and energy always play a recessionary part. That is also true of the “recovery” especially in the most recent years before the “dollar” turn in the middle of the last one. In other words, energy had been boosting wholesale sales and the overall economy more so than at any other point in the past so now that it is a drag you cannot simply take it out of your analysis for what is driving economic direction.
Further, and more important, this disparity in function is far, far beyond simply oil. The inventory problem, in particular, has shown up in every level of the supply chain, including the wholesale level apart from oil.
A good part of that imbalance has been the sudden, and very sharp, surge in the accumulation of unsold motor vehicles. If there were to be a final nail in the recovery and the narrative that tries to support it still, it would be a shutdown in auto production and sales that have been perhaps the largest single element boosting the economy to this point (which tells you how bad the rest of the economy has been since it “needed” dramatic auto gains, via debt debasement, just to eke out a plausible upward track). The inventory-to-sales ratio in autos in October was 1.77, seasonally-adjusted. That is above the 1.76 in August, thus now the highest since July 2008 (on the way down).
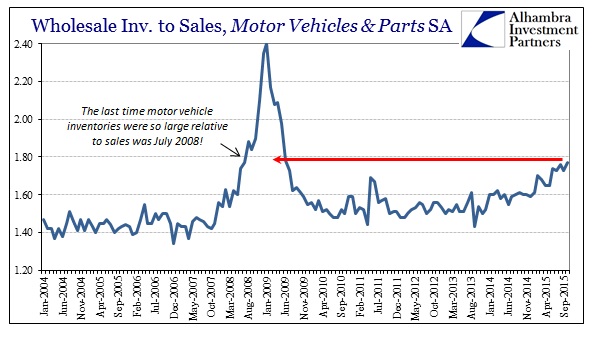
In the unadjusted series, the 1.74 ratio for October was a massive increase from 1.53 in October 2014. In fact, October’s level of inventory is so far out of historical alignment that it is only close in comparison to October 2008 – dating back to the series’ inception in 1992.
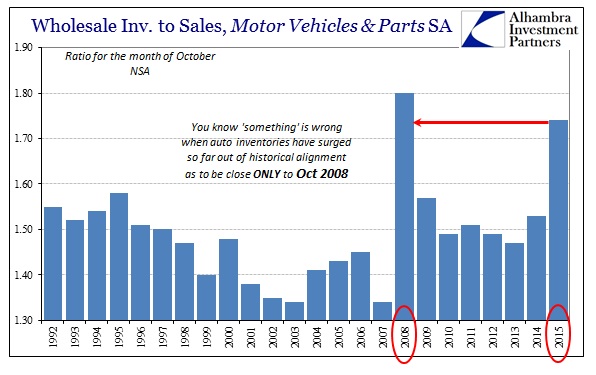
The only conclusion that can be drawn from all this is one that adds up to looming recession, far more than what has already been seen so far. The inventory imbalance has drawn on far longer than any historical precedence (especially compared to recession cycles before 1990) and has spread throughout the “goods economy” to even infest autos. There must be an adjustment at some point, as businesses cannot finance and hold inventory for Janet Yellen’s sake. I have to believe that they have been giving economists the benefit of the doubt in that concern, nervously expecting and awaiting the fairy tale to come true. Both the inventory imbalance and the persistent and lingering contraction in sales (or at least a dramatic slowing in some industries, apparently including now autos) risks an eventual economy-wide (given how widespread the inventory problem has become now) re-alignment; i.e., full recession. At this point, there is no “if” but rather “when” and, more importantly with inventory to such a great degree, “how much.”
I think that is where the comparison to the dot-com recession is relevant; we already have a contraction in sales worse than that entire period and still no inventory resolution. Quite the opposite, actually, as inventory has spun up to levels only seen just prior to the Great Recession’s full weight.

Stay In Touch