
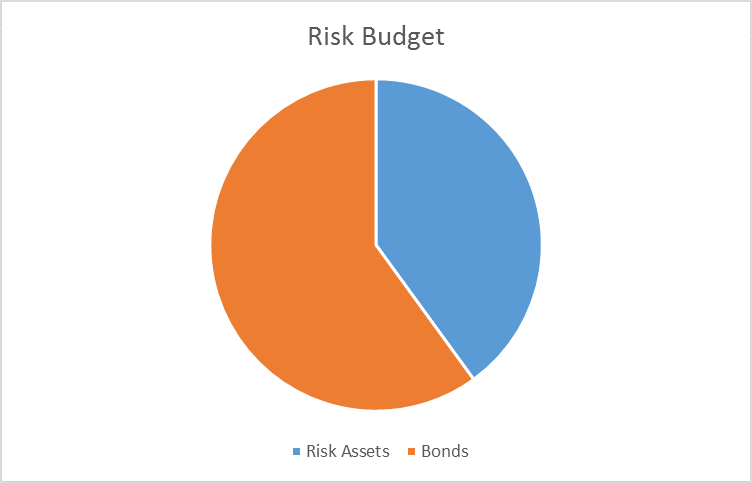
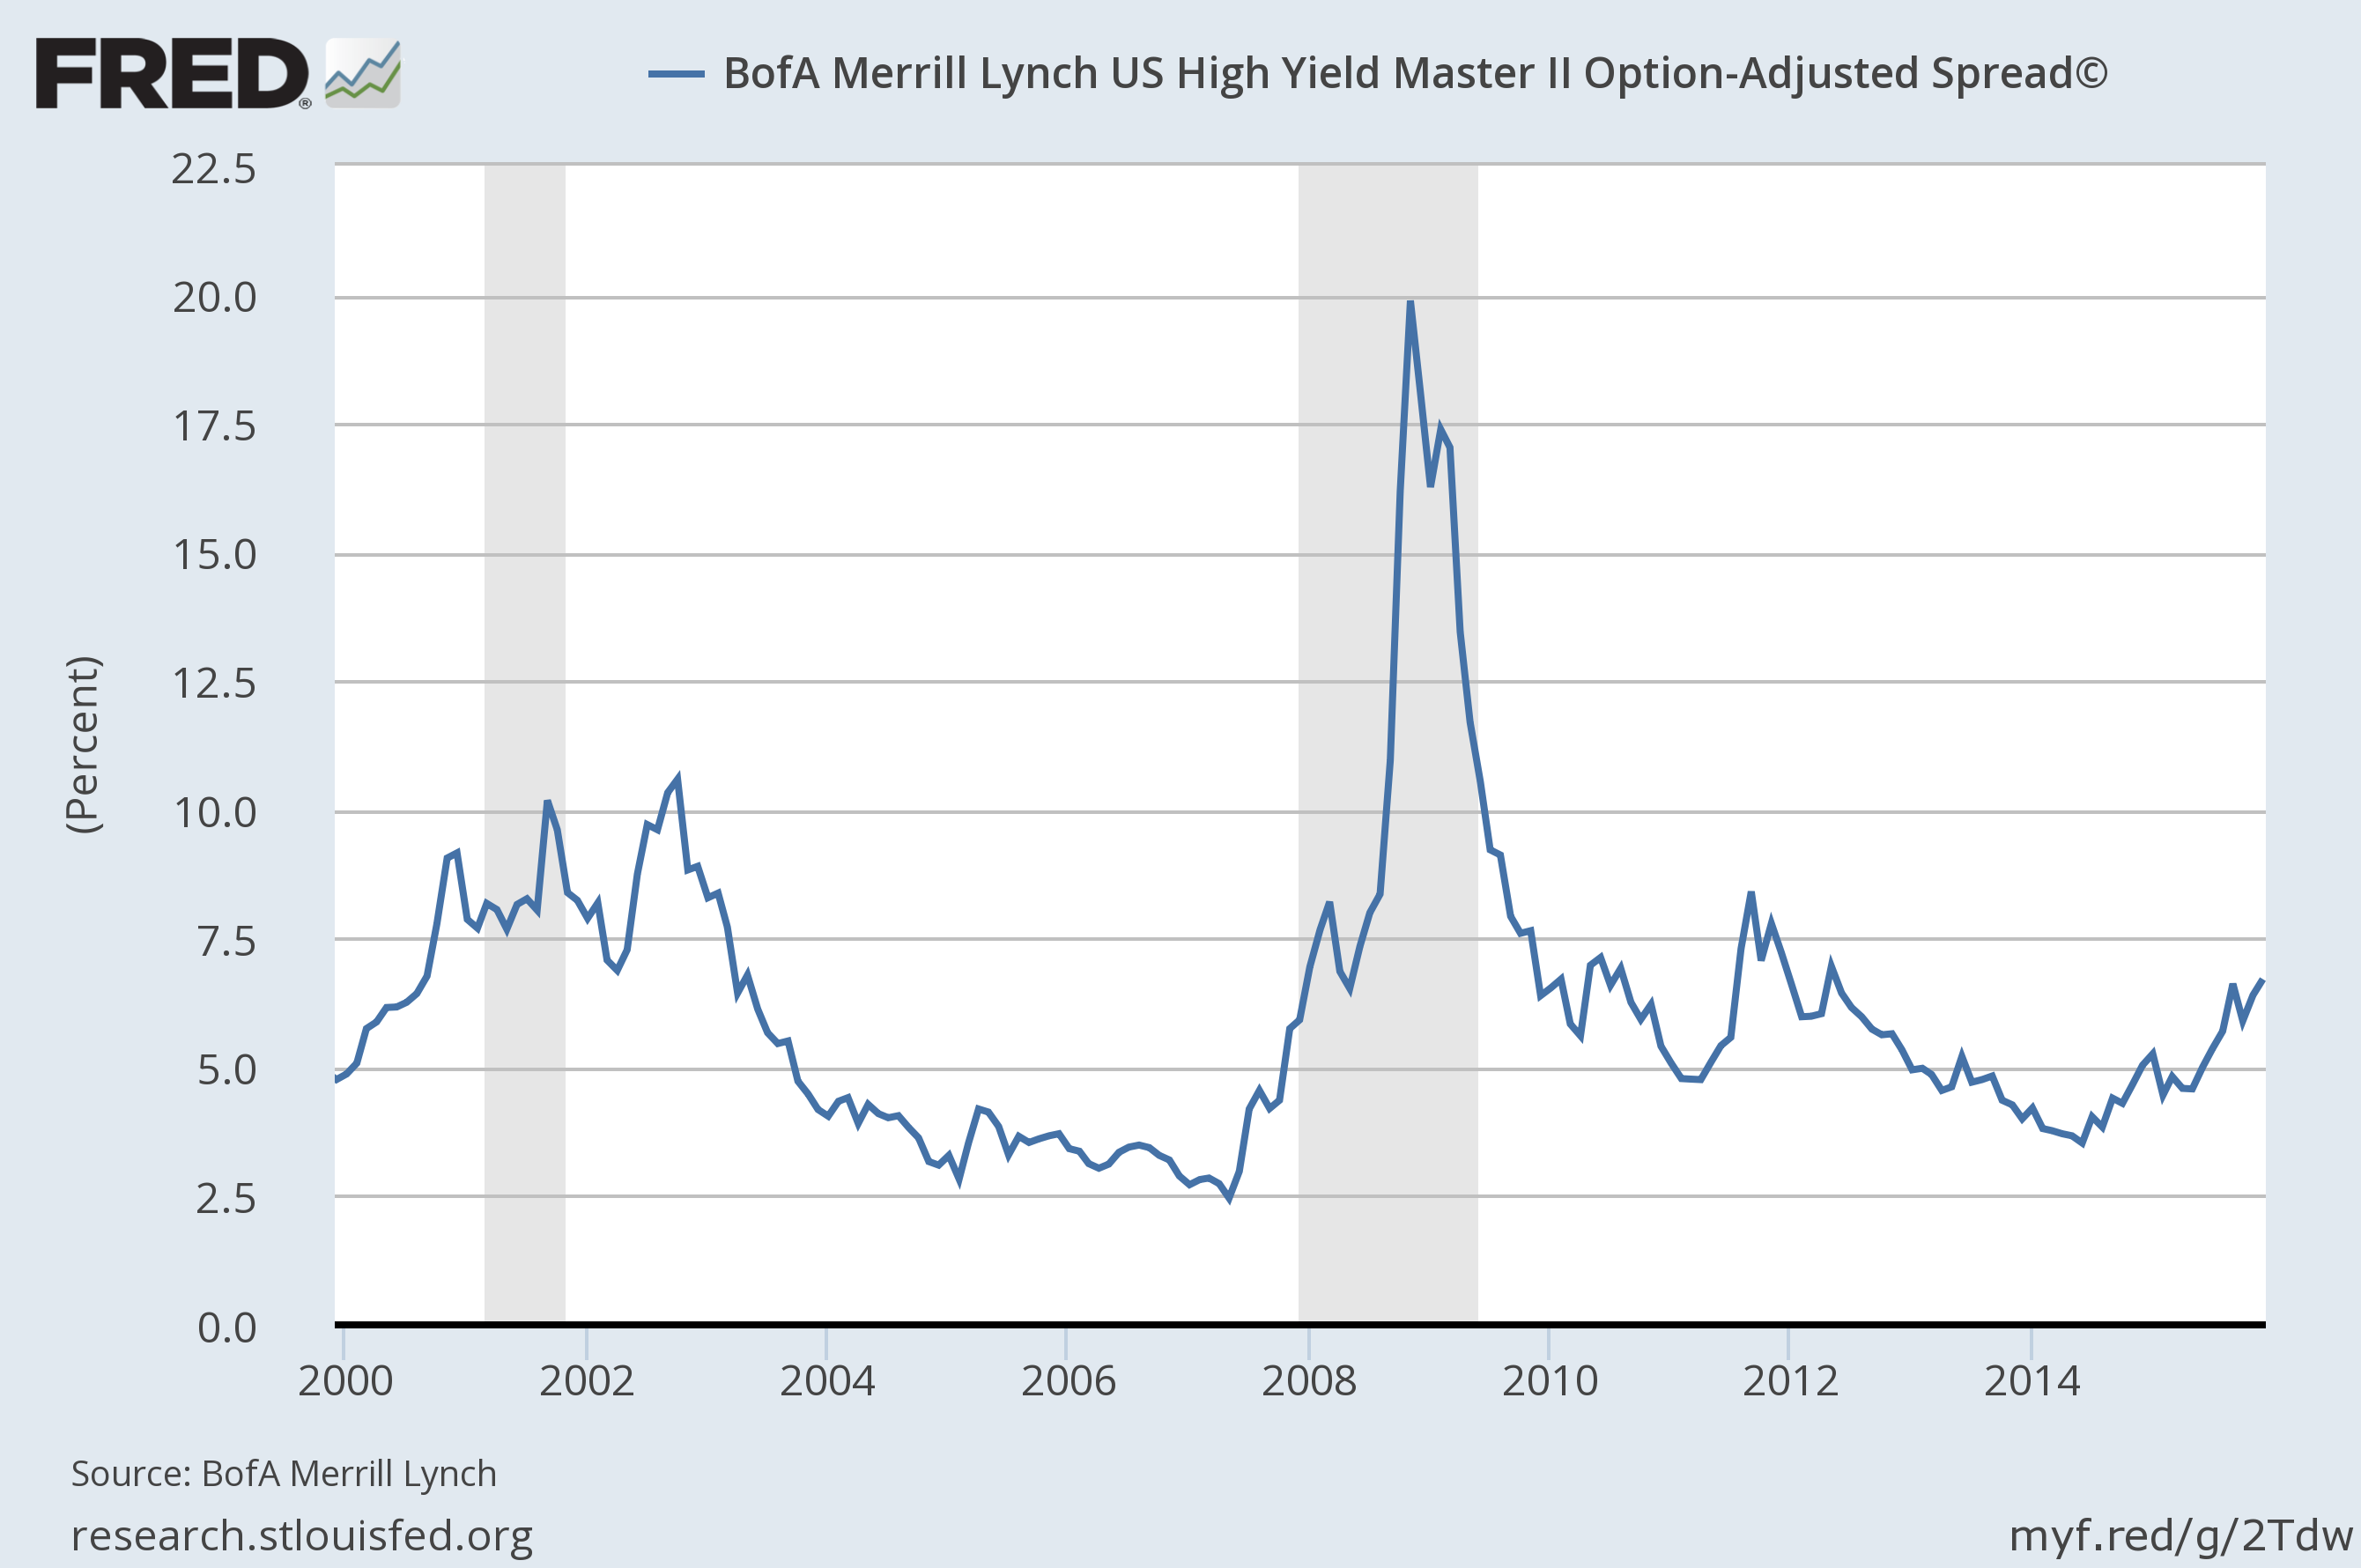
The risk budget this month is unchanged. For the moderate risk investor, the allocation between risk assets and bonds remains at a defensive 40/60 versus the benchmark of 60/40. However, we are watching credit spreads very carefully because the BofA ML US High Yield Master II OAS is approaching 7.5%. That is a level that we think should trigger a further downgrade of equity exposure.
• Credit spreads resumed their widening last month and are now near the highs hit in early October. The HY Master II spread hit 6.71% as of yesterday (12/10/15). Previous high was 6.83% on 10/2/15. In the admittedly limited history of this indicator, a level of 7.5% has only come after a market peak and when the economy was either in or very near recession (10/00 and 2/08).
• Valuations are still excessive and earnings estimates for next year are falling.
• Long term momentum is still negative. Intermediate momentum turned positive briefly but is turning back down. Short term momentum is negative.
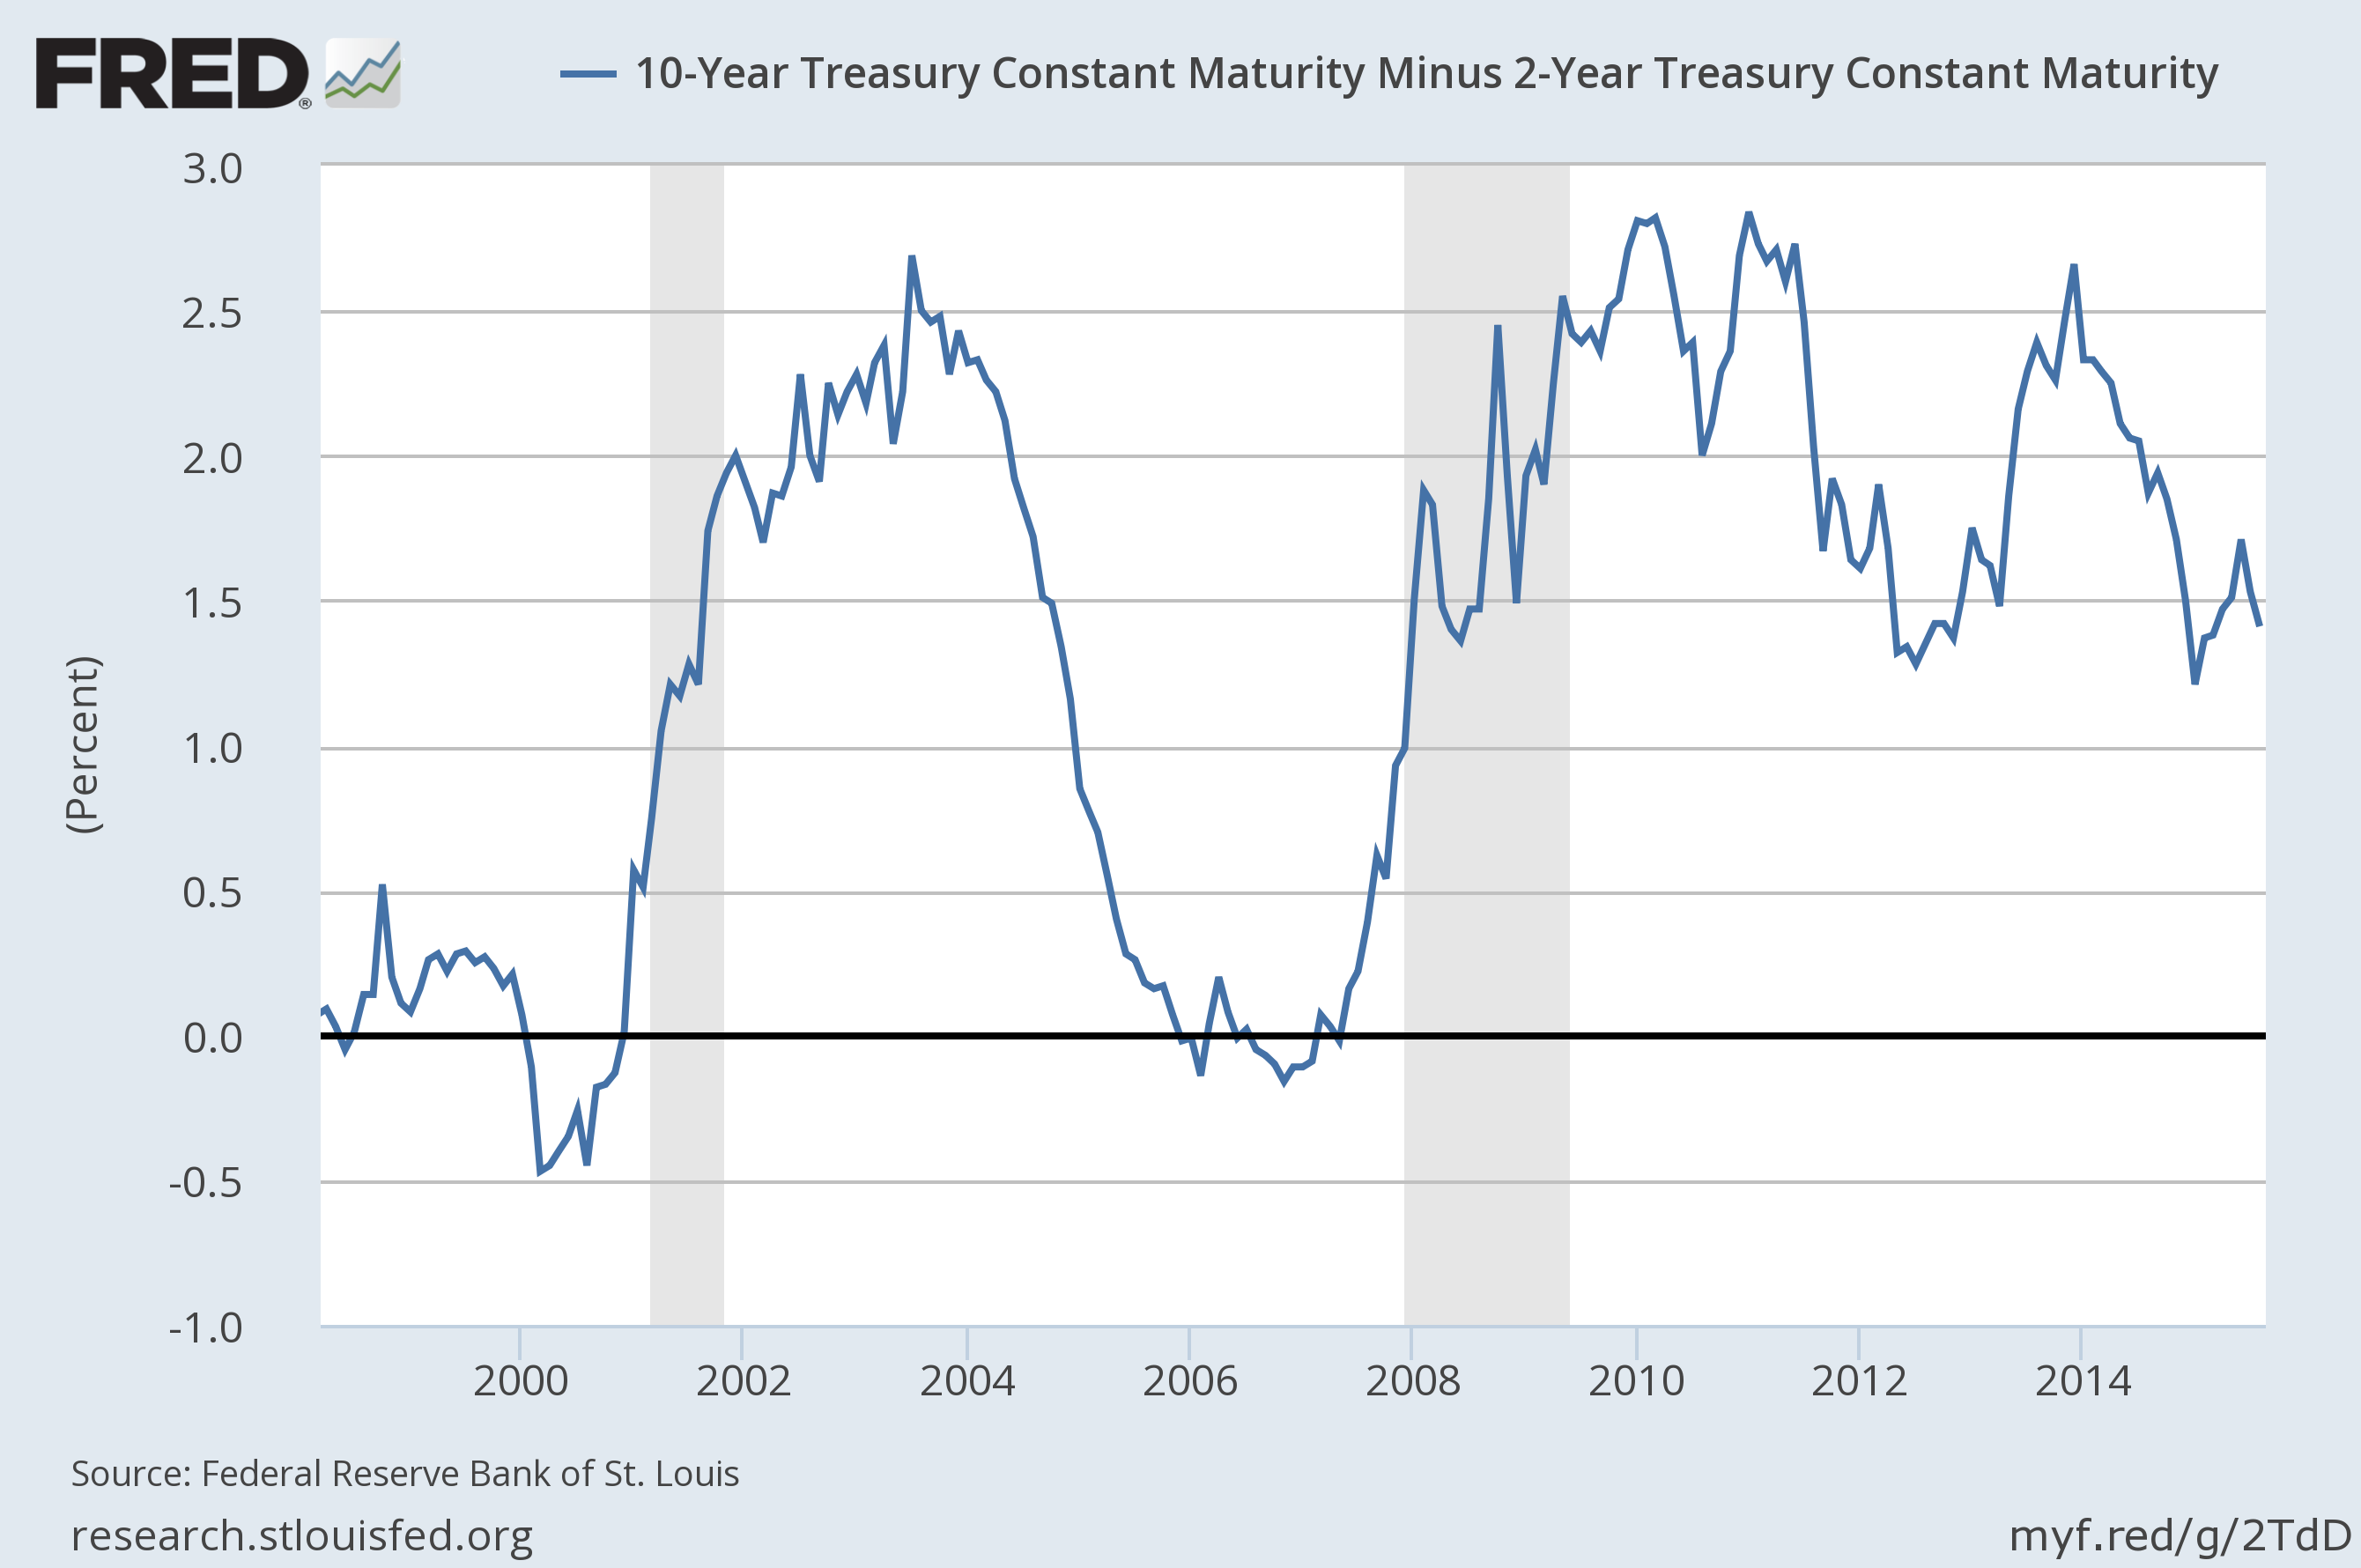
• The yield curve resumed flattening over the last month. Spread is now challenging the low set in January of this year and July of 2012. Still, the curve is in the middle of its historic range and offers no new guidance.
Credit Spreads
Credit spreads resumed their widening over the last month and are now nearing the previous peak at the beginning of October. I’m not sure where spreads will land after today but with high yield ETFs down over 2.5% and the 7-10 year Treasury ETF up almost 1%, the October high is probably toast. The market today is digesting the failure of Third Avenue Credit Fund which moved to block investor withdrawals yesterday. The fund invests in junk bonds but also in distressed debt. It had fallen over 25% already this year and was hit with a wave of redemptions. The fund elected to enter liquidation and will return what cash it can now and wait for more orderly markets to liquidate the distressed portion. When that will be is anyone’s guess but based on the trading today, it seems likely to be a while. This actually isn’t the first fund to have problems as a hedge fund ran into similar difficulty last month. That didn’t have the same impact on markets because hedge funds often have gates to prevent withdrawals but the Third Avenue fund was a plain vanilla open end mutual fund. This is seen as more a reflection of the lack of liquidity in the junk bond market than a problem liquidating distressed debt that is generally illiquid in the best of times. Whether that is fair is beside the point for now. Outflows from junk funds were already on the rise and this will not improve the mood. It may become somewhat of a self-fulfilling prophecy as redemptions force selling, which drives prices down and causes more redemptions.
As I write this spreads are still below the 7.5% threshold I’ve spoken about in the past but if we exceed that level soon, I may have to reassess our allocation to stocks. Widening credit spreads can push the economy into recession pretty quickly and our economic data hasn’t been all that robust in any case. Spreads are already wider than the start of the last recession but junk wasn’t the problem back then. I would think that wider spreads – something nearer the levels in 2001 – would be required to actually push us into outright contraction. I also think one should probably err on the conservative side since we really don’t know.
Yield Curve
The yield curve continues to flatten, moving toward the levels of early this year and in 2012. As I’ve said many times, I have no idea whether the curve will ever get to flat before the next recession. It always has in the past but we’ve never had interest rates pegged at zero for this long except back in the 1940s when conditions were vastly different. I do think though that if the market starts to sniff a recession you’ll see the curve steepen rapidly as short rates collapse. That’s what has happened in the past just from a flatter curve.
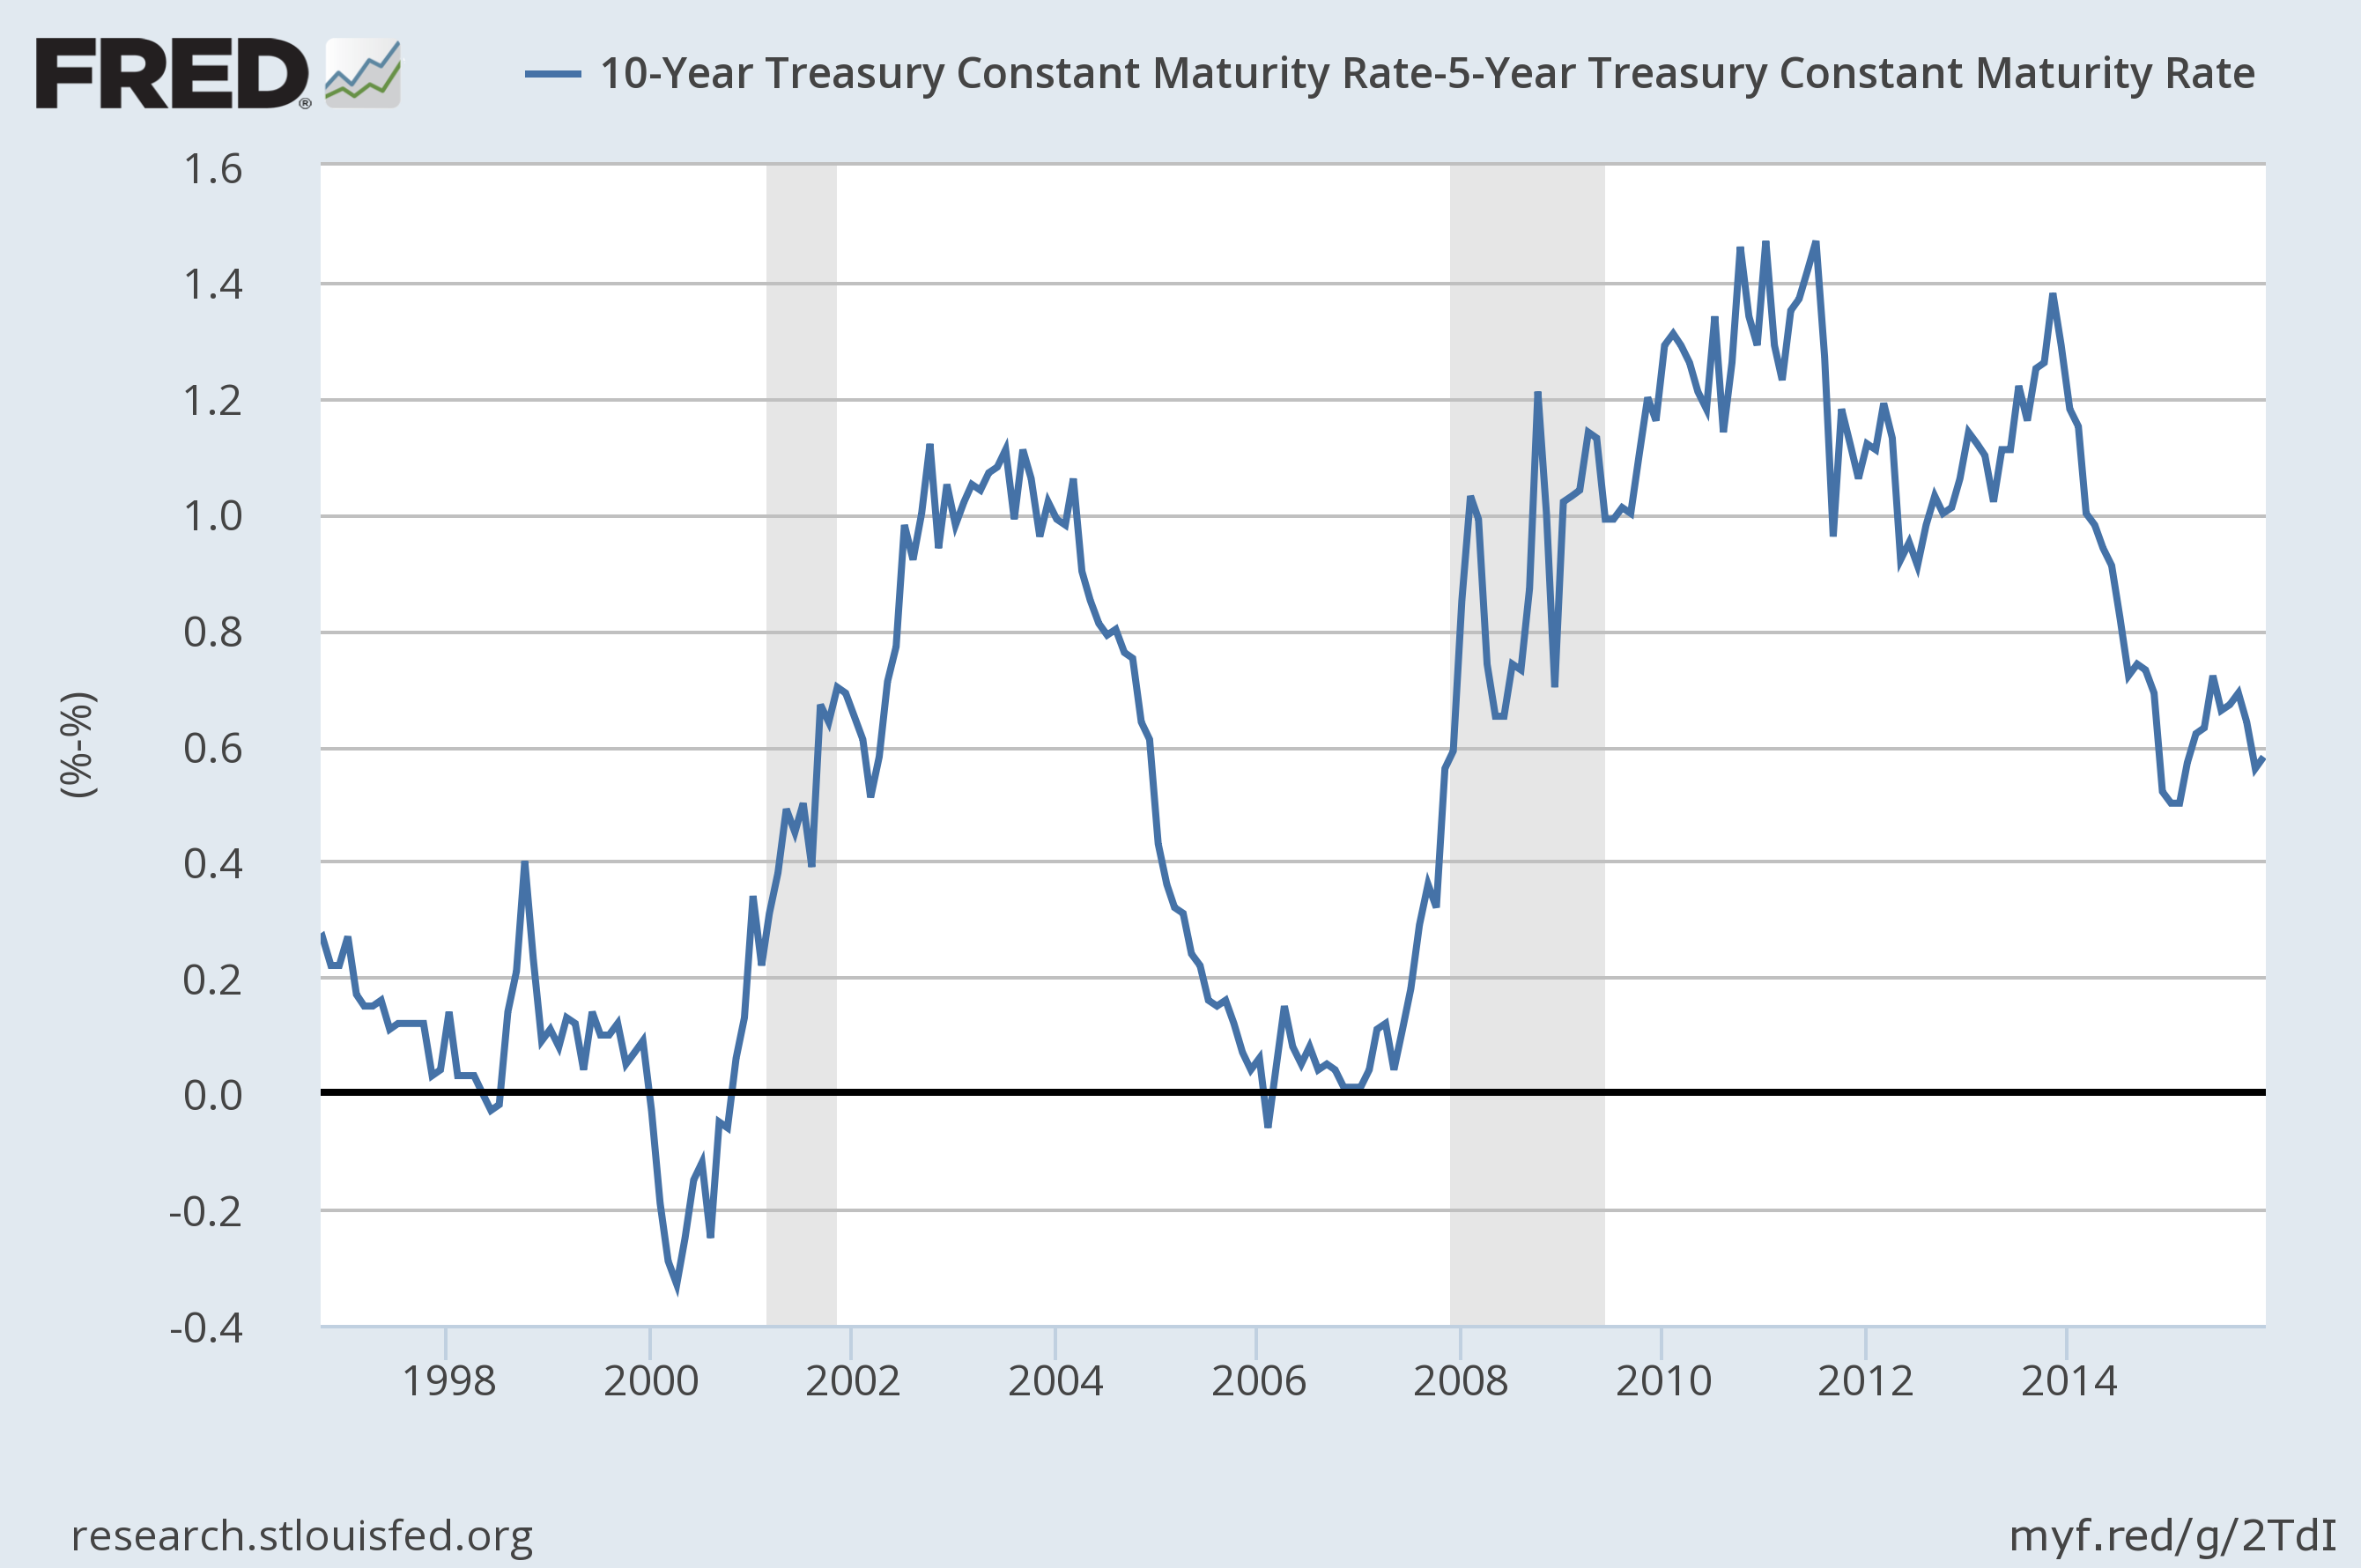
The 10/5 curve offers a similar view:
Valuations
Valuations are improving somewhat as stocks fall but with revenue and earnings falling as well, it certainly isn’t enough to call things cheap. Junk bonds are a lot cheaper than they were but deservedly so and I have no confidence the worst isn’t yet to come. International stocks are cheaper than the US and emerging markets as a whole are the cheapest of the bunch but I have no appetite for catching falling knives and see no reason to do so. If the US is headed for recession there is no way the rest of the world won’t be affected too. If the US isn’t headed for recession right now – and we don’t have enough evidence to make a call either way yet – then we still need to see some stabilization in the currency markets before making any foreign commitments. As plenty have found out this year, currencies play a big role in determining your return when investing outside the dollar. I am still maintaining an overweight to international versus US stocks based on valuation but the overall allocation to equities is low. Patience is required here.
Momentum
Last month I said the recent rally was looking more every day like what my trader friends and I call the Gentleman’s Exit. That’s the rally we always seem to get after the initial selloff that starts a bear market. In the 2000 top we got an initial selloff in the spring but didn’t really break down until the fall. In 2007 we got the first downdraft in August but didn’t peak until late November. This year the first correction was August and now we’re rolling over again. Momentum has given us numerous warnings, starting early this year when our long term momentum indicator triggered its first sell signal since late 2007. Since then the market has bounced up and down but that long term momentum signal has stayed resolutely on sell. And with the selling this week it is starting to accelerate. Now we’ve got both short and long term momentum indicators on sell:
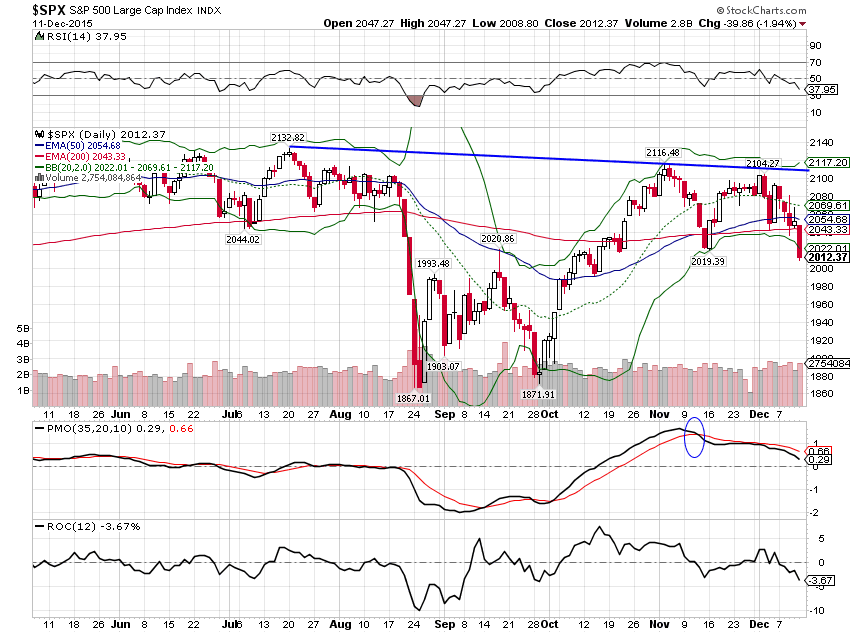
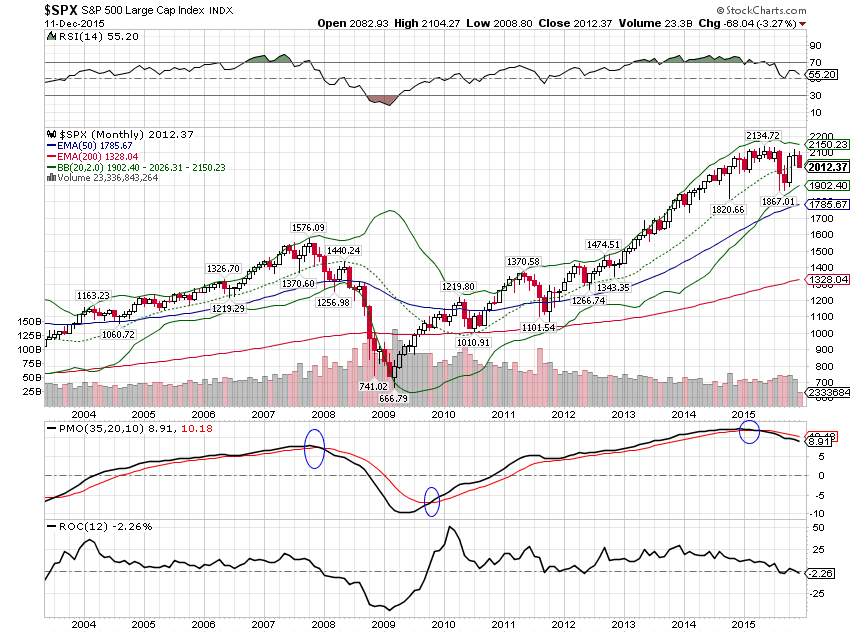
Momentum often leads price and this appears to be no exception. The S&P 500 lost its mojo over a year ago and has made essentially no progress since September of 2014. I don’t know if this will be a bear market or a correction or what but momentum has given us ample warning and time to prepare.
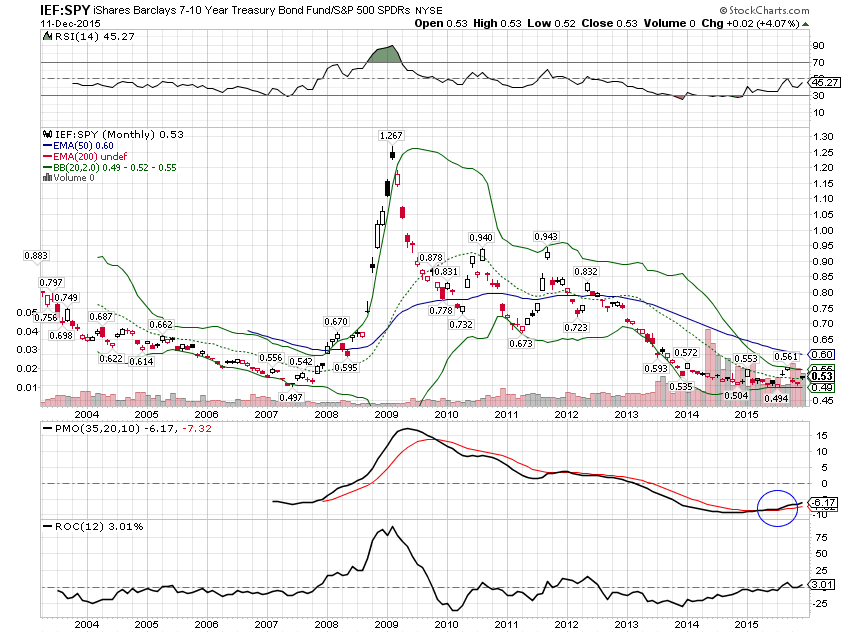
Momentum still favors Treasury notes/bonds over stocks despite the tightening expectations:
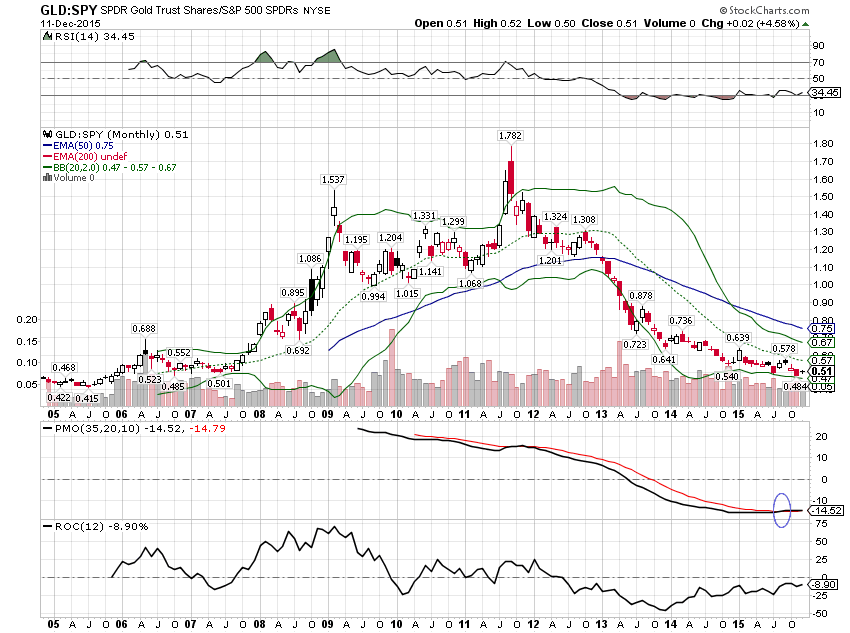
It isn’t as clear cut but even gold is favored over stocks from a long term momentum perspective:
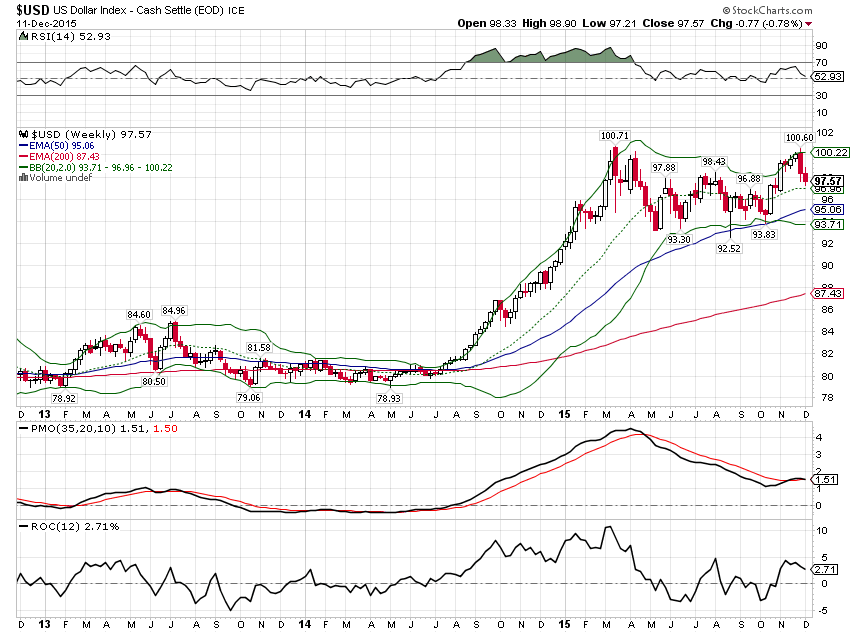
As bad as the US had been this year, it is still outperforming its foreign counterpart, EAFE.
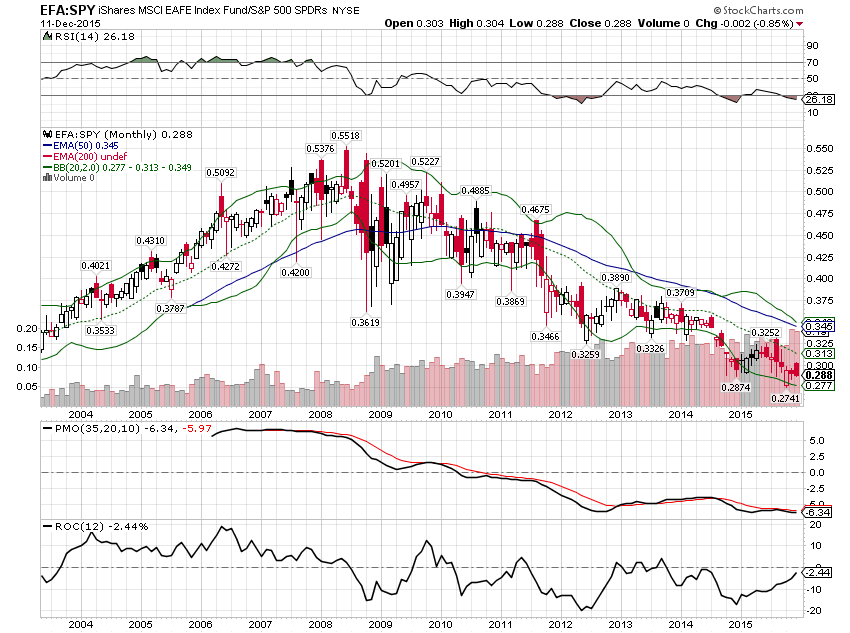
That is however, mostly a function of the US dollar that was turned back at resistance when then ECB disappointed market expectations. Long term momentum still favors a higher dollar but short term has flipped negative and intermediate is neutral and trending lower. With lower valuations and momentum shifting I think it makes sense to continue to maintain the overweight to EAFE.
There is still no reason to own commodities in a broad way. We have a small allocation to gold based on that long term shift in momentum versus stocks, extremely bearish sentiment and the potential reversal in the dollar but have no desire to allocate more to the yellow metal just yet.
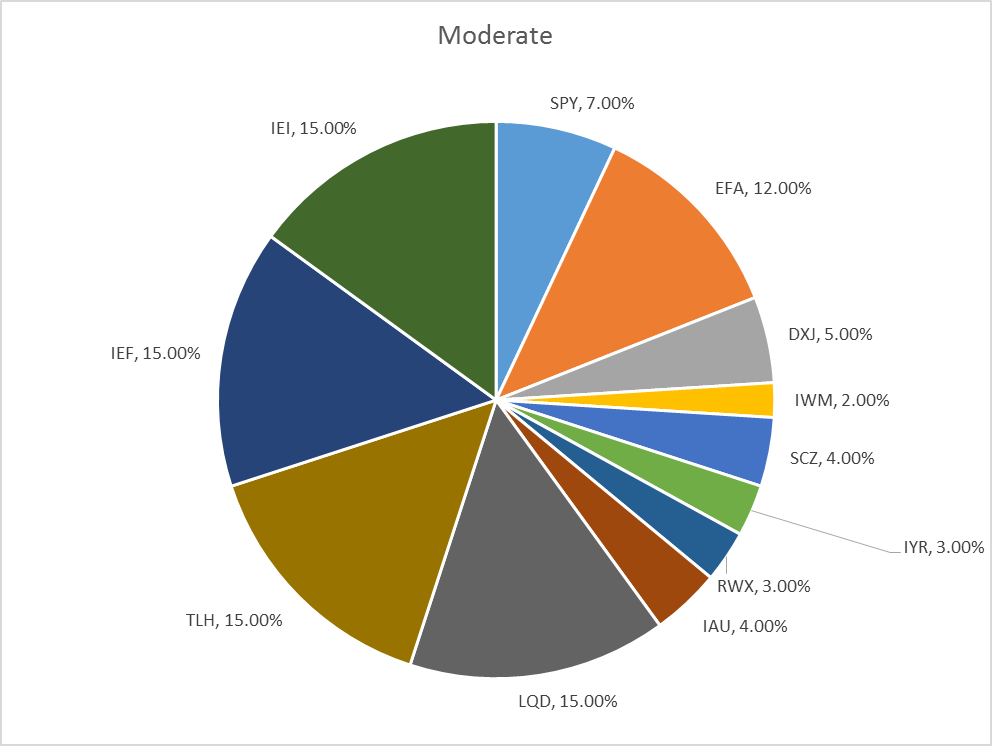
Our moderate risk allocation has not changed for the month:
Momentum Asset Allocation
I also run two asset allocation models (one aggressive, one more moderate) based on momentum. These models ignore all fundamental and economic information in favor of just allocating to the asset classes that are exhibiting momentum. Here’s where those models stand as of today (rebalancing is monthly):
Aggressive Version:
50% SPY
50% IYR
Moderate Version:
25% IYR
25% TLT
25% TLH
25% Cash
The aggressive version of this allocation method does not incorporate the risk control parameters of the more moderate version and that means that despite our views on the stock market, SPY gets an allocation this month. Of the assets in that version of this allocation method – the two versions don’t have the exact same assets to choose from – IYR was the best performing asset available. The moderate version uses a risk control method that prevents purchasing any ETF that is trading below its 125 day moving average. This month that means an allocation to two long term bond ETFs, REITs and Cash.
More information on these momentum models can be found here.
Click here to sign up for our free weekly e-newsletter.
“Wealth preservation and accumulation through thoughtful investing.”
For information on Alhambra Investment Partners’ money management services and global portfolio approach to capital preservation, Joe Calhoun can be reached at: jyc3@4kb.d43.myftpupload.com or 786-249-3773. You can also book an appointment using our contact form.
This material has been distributed for informational purposes only. It is the opinion of the author and should not be considered as investment advice or a recommendation of any particular security, strategy, or investment product. Investments involve risk and you can lose money. Past investing and economic performance is not indicative of future performance. Alhambra Investment Partners, LLC expressly disclaims all liability in respect to actions taken based on all of the information in this writing. If an investor does not understand the risks associated with certain securities, he/she should seek the advice of an independent adviser.
Stay In Touch