
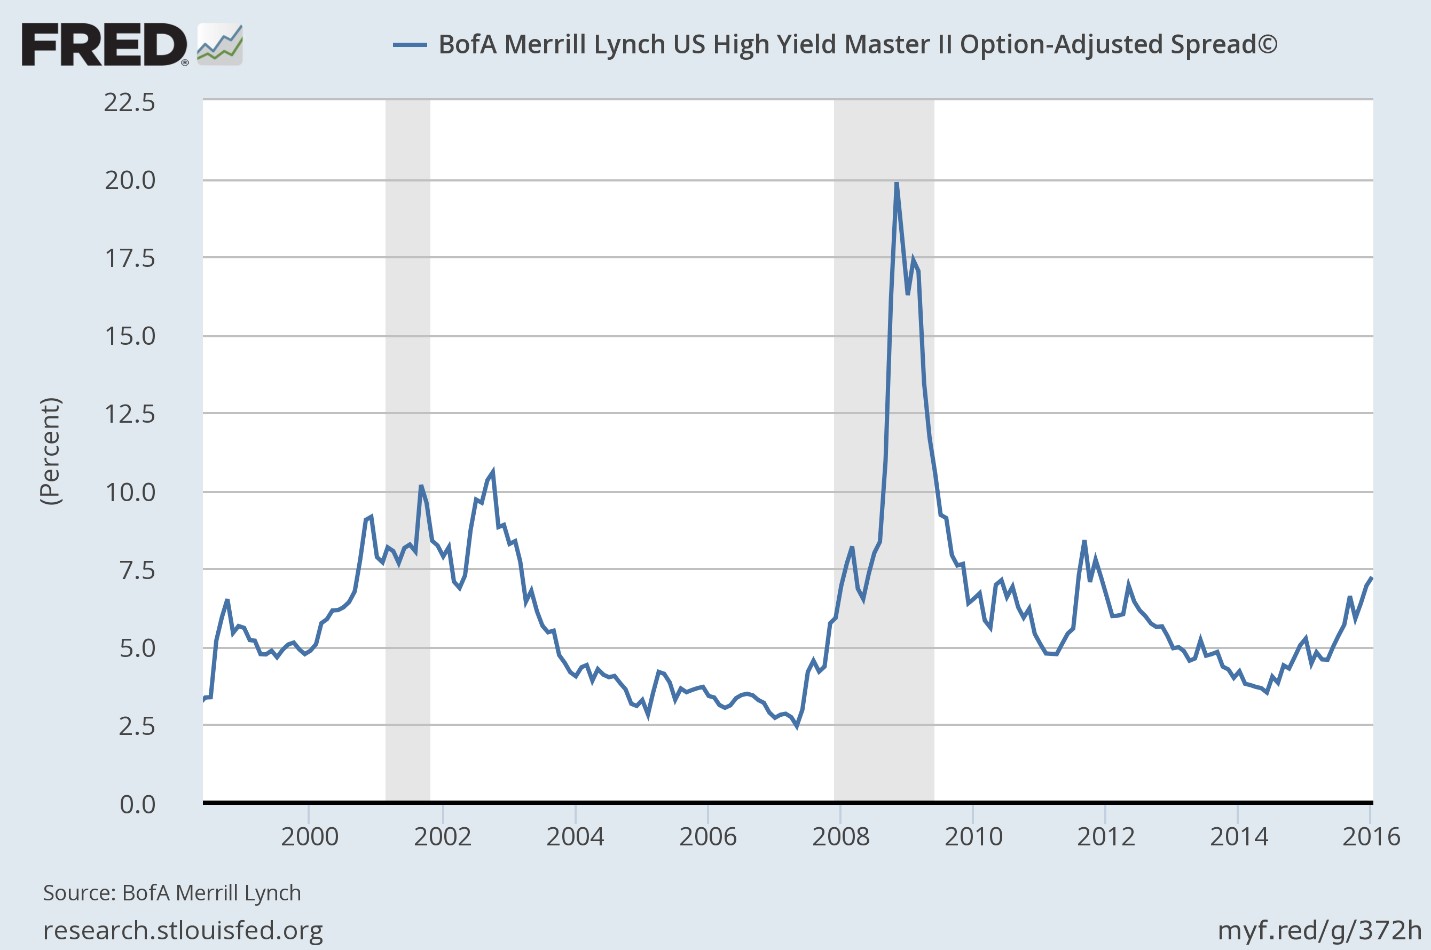
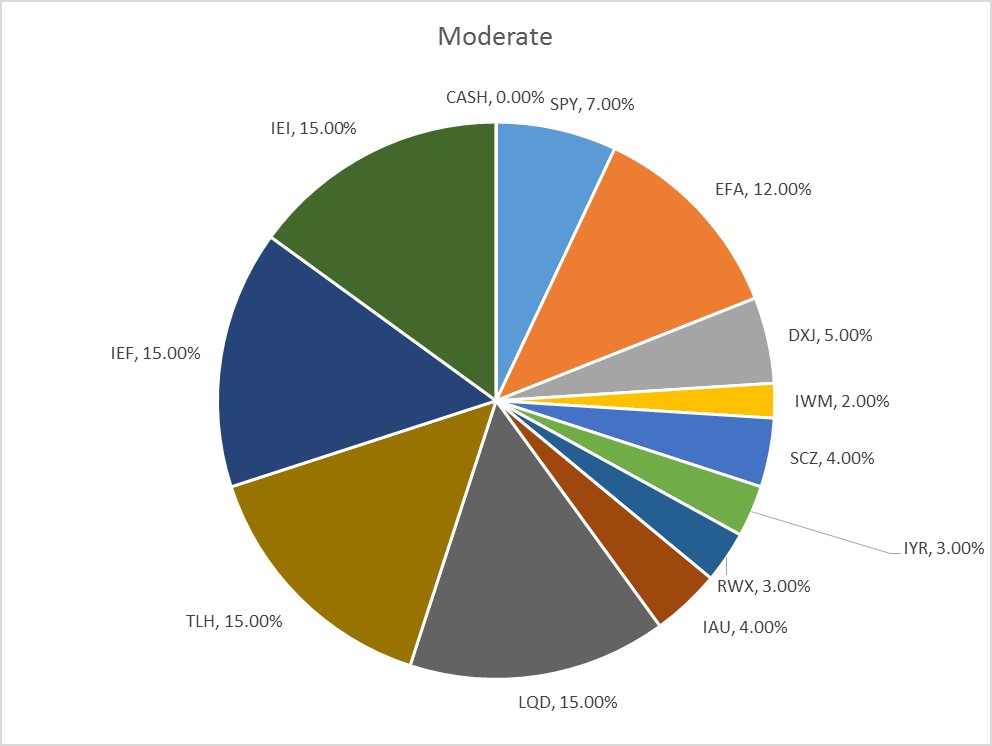
The risk budget this month is unchanged. For the moderate risk investor, the allocation between risk assets and bonds remains at 40/60 versus the benchmark of 60/40. The BofA ML US High Yield Master II OAS did widen on the month but still remains below the 7.5% level I identified last month as a trigger point for a further reduction in risk assets. The sell-off in stocks at the beginning of the year, interestingly, has not been accompanied by a significant change in credit spreads. It appears that stocks are merely playing catch up to spreads that started moving wider months ago. Despite the sell-off, it is noteworthy that stocks are still above their August lows. They are approaching those levels rapidly though and even if they bounce there, I believe we will eventually breach those lows.
- HY credit spreads are currently at 7.24% versus 7.1% at the last GAA update. There has been further degradation in lower rated credits; CCC bonds have moved another 81 basis points wider but with those spreads already over 16%, further widening probably has little significance.
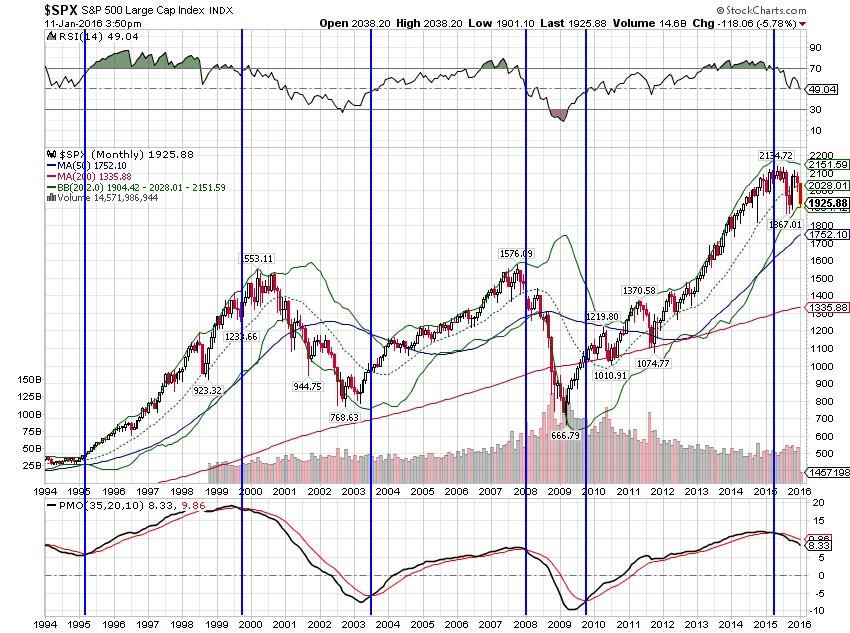
- Valuations are still excessive and earnings estimates are still falling although analysts still seem convinced that earnings will surge in the back half of the year. I don’t think there is a lot of conviction about that, probably more a matter of inertia. Trailing P/Es have actually been increasing lately as earnings have fallen and stock prices have not. That is obviously changing even as I write this but trailing numbers really don’t provide much in the way of useful information anyway.
- Long term momentum has continued to weaken with short and intermediate momentum also now fully negative. Daily momentum readings are getting oversold but are not even yet at the August levels so this correction could carry a bit further before a decent bounce. With long term momentum fully negative and nowhere near oversold, rallies should probably be used to reduce or eliminate any questionable positions.
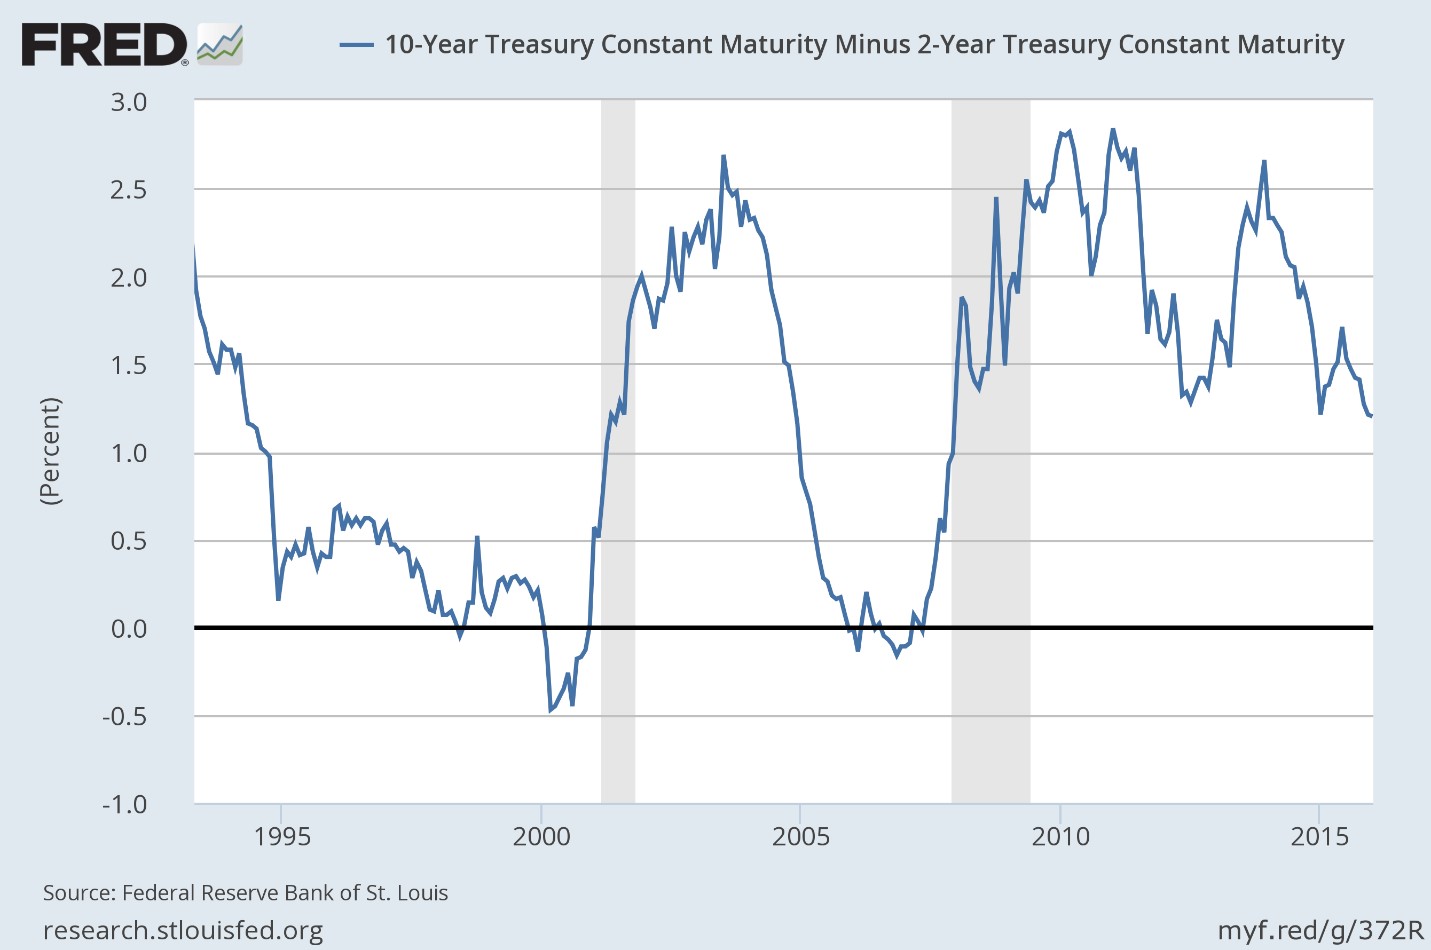
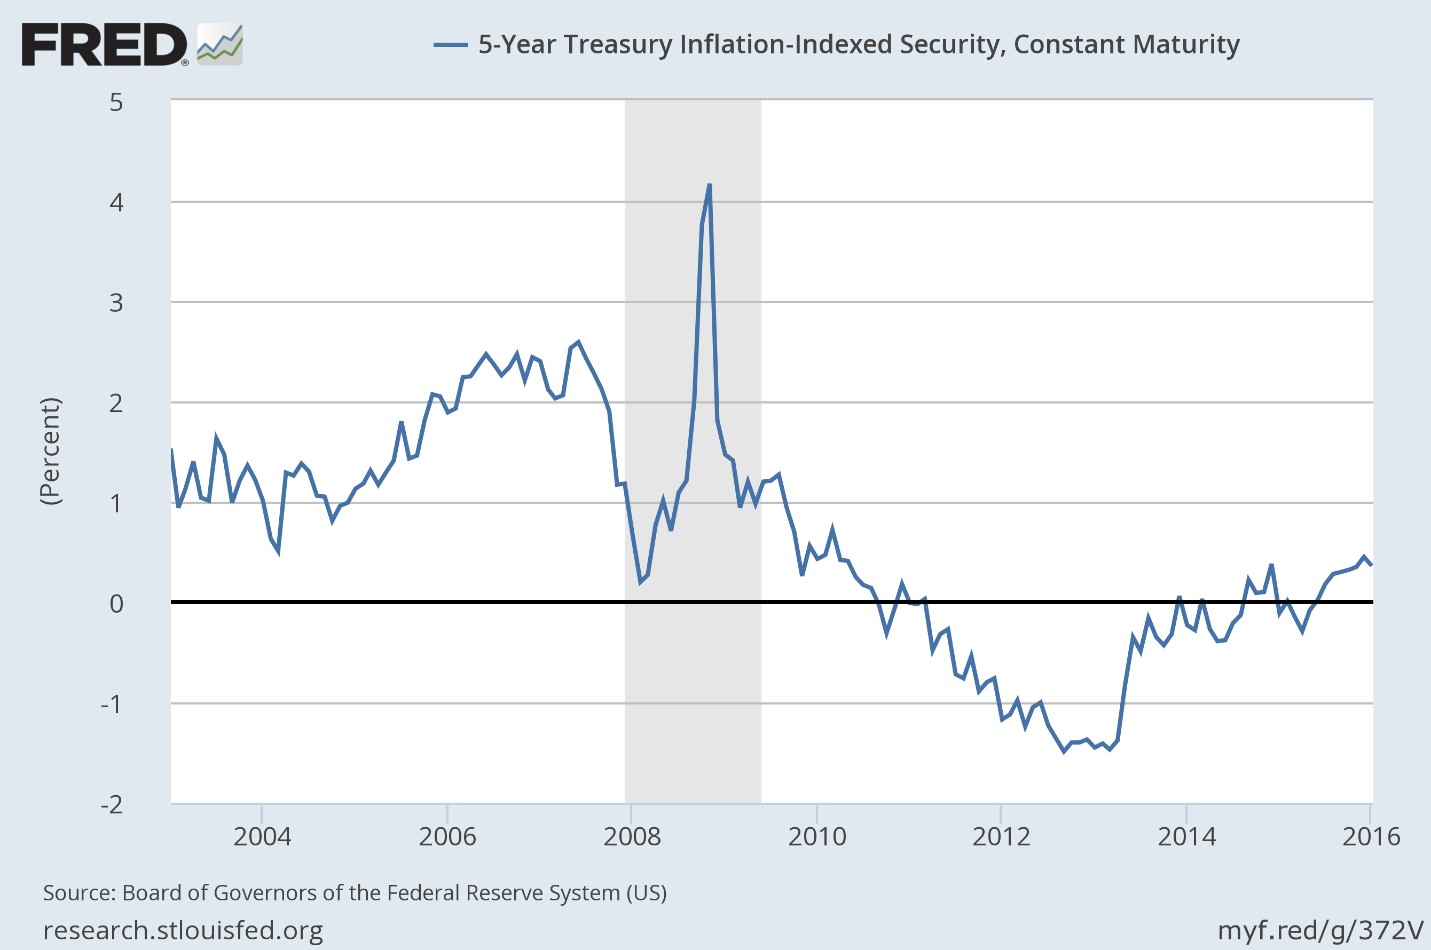
- The yield curve continued to flatten although the movement wasn’t significant. The 10/2 spread is now at 1.2% versus 1.26% at the last update. TIPS yields and inflation expectations were essentially unchanged over the last month which is quite interesting considering the action in the stock market since the beginning of the year. It seems the stock market sell-off is not being driven by a change in growth expectations, real or nominal.
Credit Spreads
While spreads did continue to widen over the last month, we have not seen a blowout as one might expect given the recent stock market turmoil. The junk bond market is obviously still stressed and with oil and other commodity prices continuing to fall, I see no reason to believe that we have seen the worst yet. Most of the stress – but not all as I’ve pointed out repeatedly – has been in energy and materials related names and there is no end in sight with oil now under $32. Arch Coal, a large coal producer, filed bankruptcy today seeking to reduce its $4.5 billion debt load. Somebody is going to take a haircut. The default rate is rising and if we get a more general recession it will accelerate. As to the odds of that happening I’d say they are somewhat higher now than they were a month ago if for no other reason than the recent drop in auto sales. If manufacturing was in recession with auto sales over 18 million that surely didn’t improve with them dropping to the low 17s.
The economic data has generally maintained its negative tone but so far there seems to be no acceleration to the downside. The junk bond market has actually stabilized a bit even as stocks have sold off hard to start the year. So the stock market turmoil would not appear to be driven by reduced US growth expectations or fears about further stress in the US economy. The accepted narrative about the stock market correction actually makes little sense to me. If China’s currency and stock markets are being negatively affected by capital outflows as so many seem to believe, why exactly would that be bad for US stocks? Where do these pundits suppose that capital might be flowing? Europe? I suppose some of it maybe but the more likely destination is the US markets, real estate, stocks and bonds. I have a problem seeing that as a reason to get panicky about US assets. There are plenty of reasons to be concerned about US stock prices but fear of Chinese capital flight shouldn’t make the list.
Spreads continue to indicate stress, could be consistent with recession and warrant reduced risk allocations.
Yield Curves
Yield curves generally continued to flatten but overall there was little change over the last month. Just as with credit spreads there is little evidence in the shape of the yield curve that would indicate a further deterioration in the economic growth outlook. In addition to the yield curves, the TIPS market and inflation expectations show little change. TIPS are a proxy for real growth expectations and there was little change. The 10 year TIPS yield moved by all of 1 basis point over the last month while the 5 year dropped by a not alarming 3. 5 year/5 year forward inflation expectations fell by all of 7 basis points over the last month. That just isn’t enough to mean anything. If stocks have been falling because of fears over US growth it would surely show up somewhere in the bond market and I just can’t find it.

Valuations
Long term valuation measures such as Shiller P/E, price to sales, market cap to GDP have all come down slightly but only very slightly. Shiller P/E has come down from 26.6 to 24.4 but that is still well above the 16.7 median level. Total market cap to GDP has fallen from 124 to 110 a level that implies annual returns of roughly 1.5% and that includes dividends. S&P 500 price to sales ratio is currently 1.67 while the median is 1.43, the low 0.80 (March ’09) and the high 1.8 (June ’15). There are plenty of other measures one can use but all of them show a market at least mildly overvalued.
It is hard to make a compelling bullish case for US stocks based on valuations. Foreign markets are much cheaper with some of them at all time low Shiller P/E levels. A few examples:
Brazil current Shiller P/E 7 equaling the all-time low
Russia current = 5, all time low = 5
India current = 17, all time low = 16
Italy current = 11, all time low = 6
Spain current = 11, low = 7
EAFE current = 14, low = 11
Emerging markets current = 11, low = 11
Of course, we don’t have nearly as much data on some of these markets as we do the US so some of the lows may just get lower. India, for instance, we only have data back to 1994, so the low of 16 seems quite high and destined to be lower at some point in the future. EAFE on the other hand, we have earnings data back to 1972 so at least a decent data set. A bad bear market would probably take that down to single digits. But if the destination is single digits I’d rather travel that from 14 than 24.4.
EM is also very cheap and with the sentiment off the charts negative it is very tempting to take a small position but the negative momentum keeps me on the sidelines. I would prefer to see a little more downside action in the dollar before committing to EM equities.
Momentum
Our long term momentum indicator shifted to a sell signal in early 2015. Our technical research partner, MSA, also identified that as a major turning point (and also pinpointed the 2130 high for the year at the time). It would take a major move higher to change the long term momentum situation at this point. In fact, unless the market is about to do something it has never done, I’d say the odds of a reversal and long term momentum buy signal from these levels is basiclly zero. Of course, we can rally from here and short and intermediate term momentum can shift but the long term top appears to have been made. Whether the downside is similar to the last two 50% drawdown bear markets I can’t say. It could be a bear market in time more than price but any upside for now should be capped at the downtrend line.
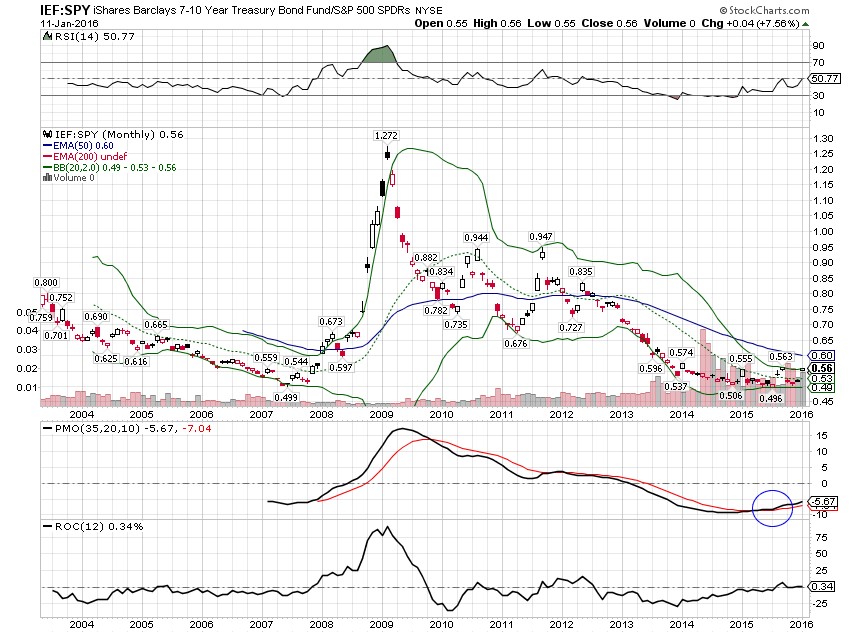
As I’ve pointed out in other recent asset allocation updates, momentum has shifted to long-term Treasuries from stocks. That trend has only been reinforced since the beginning of the year:
Another ongoing shift is from stocks to gold although that trend is still not as obvious and entrenched as the bond/stock shift:
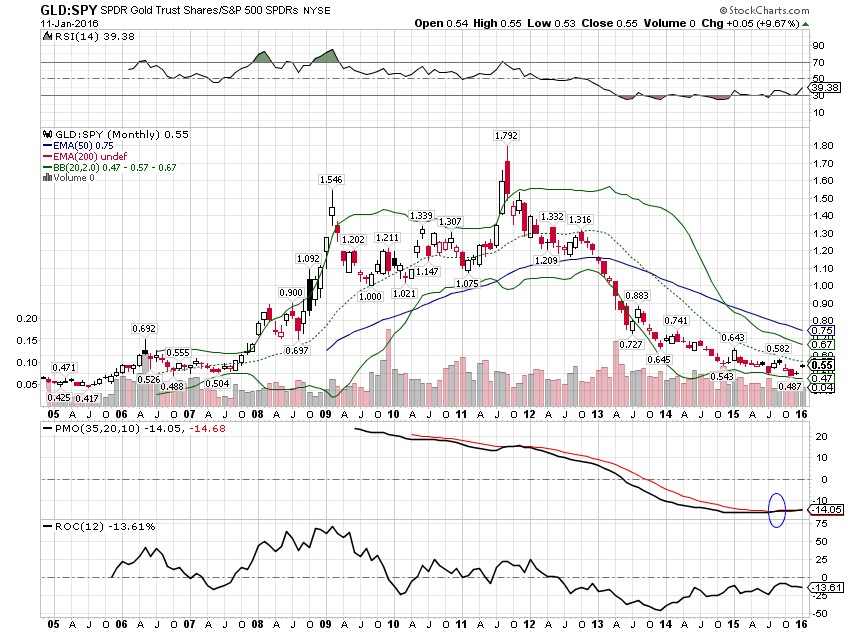
MSA says the relative performance shift from stocks to gold is not complete yet but we’ve already taken a small position in anticipation. MSA has also indicated a preference for gold stocks over the metal a sentiment with which I agree. When the momentum shift is clearer I will likely add an allocation to gold stocks for all but the most conservative accounts.
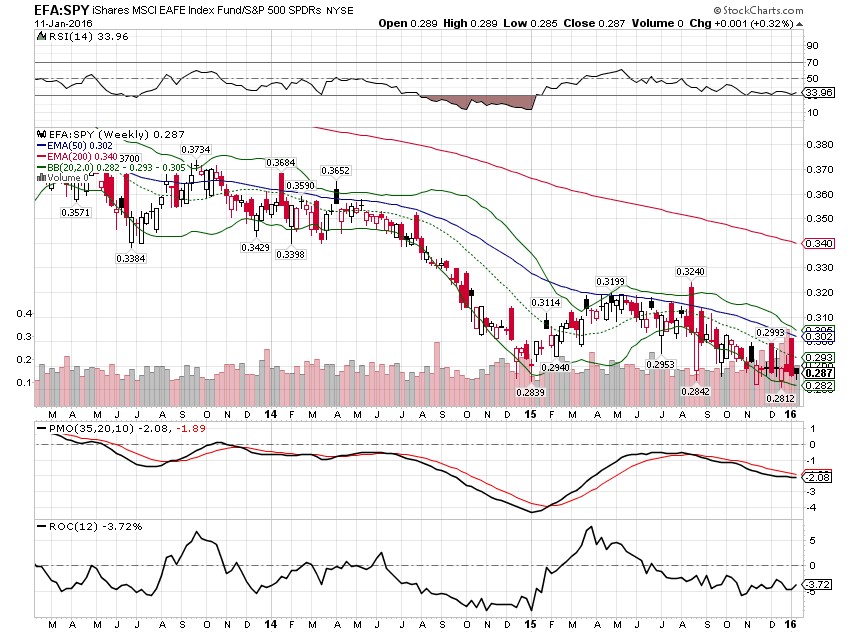
Our overweight to EAFE versus S&P 500 is based on valuation but I also think the technical picture will eventually favor foreign markets. That is probably more a function of the dollar more than valuation and while the dollar has stopped rising it hasn’t as yet put in much downside action. Nevertheless, EAFE is holding its own against the US for the last few months:
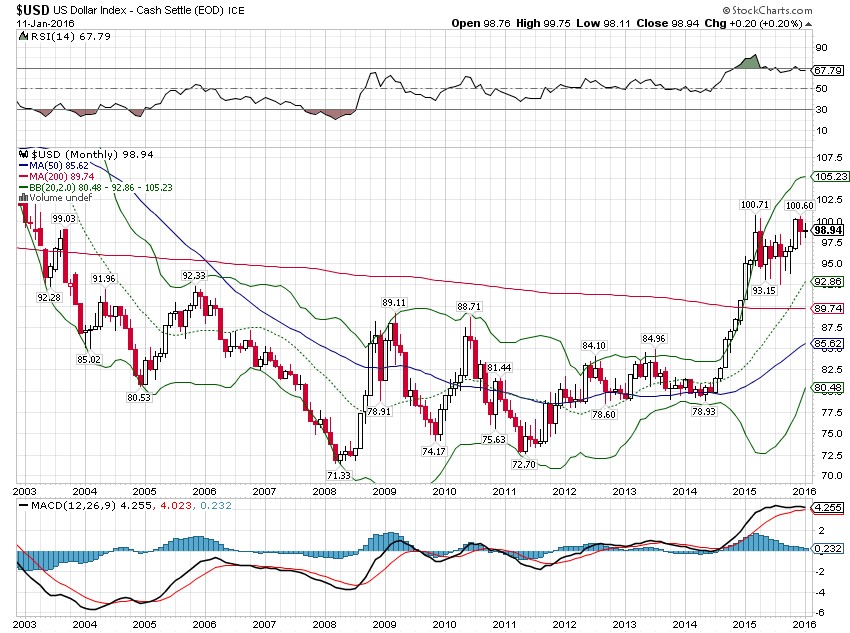
As for the dollar, long term momentum has gone flat and I expect the next move to be down:
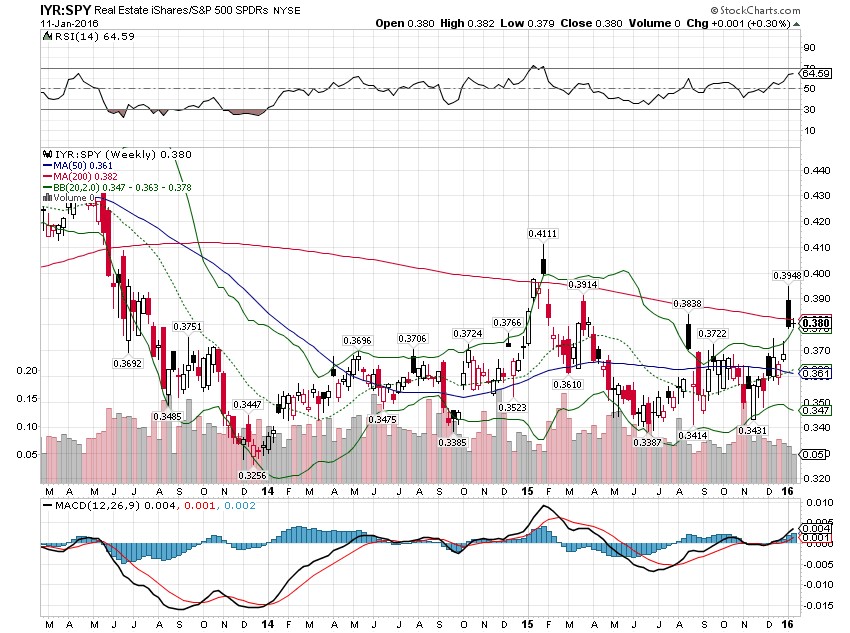
REITs continue to perform well versus US stocks and we maintain a small position:
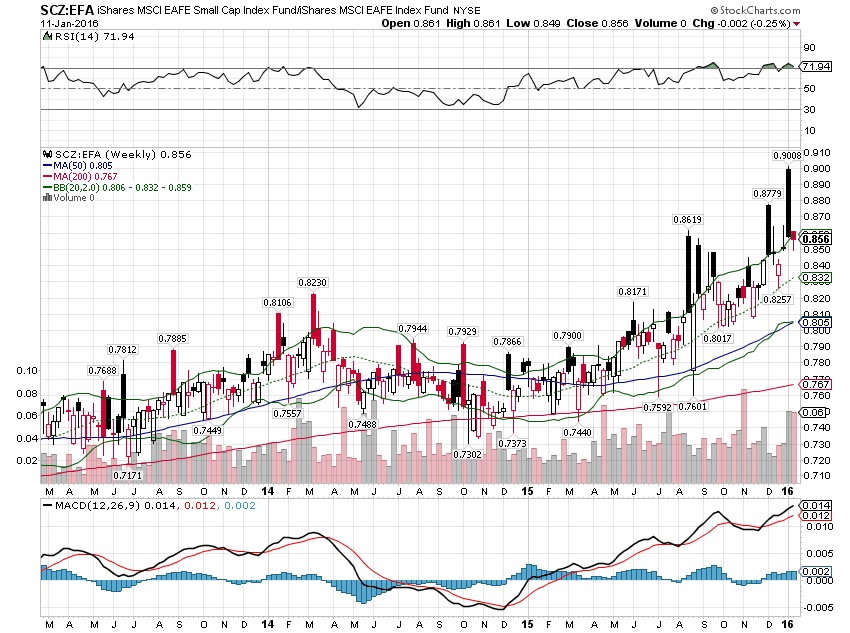
EAFE small cap continues to outperform EAFE large cap:
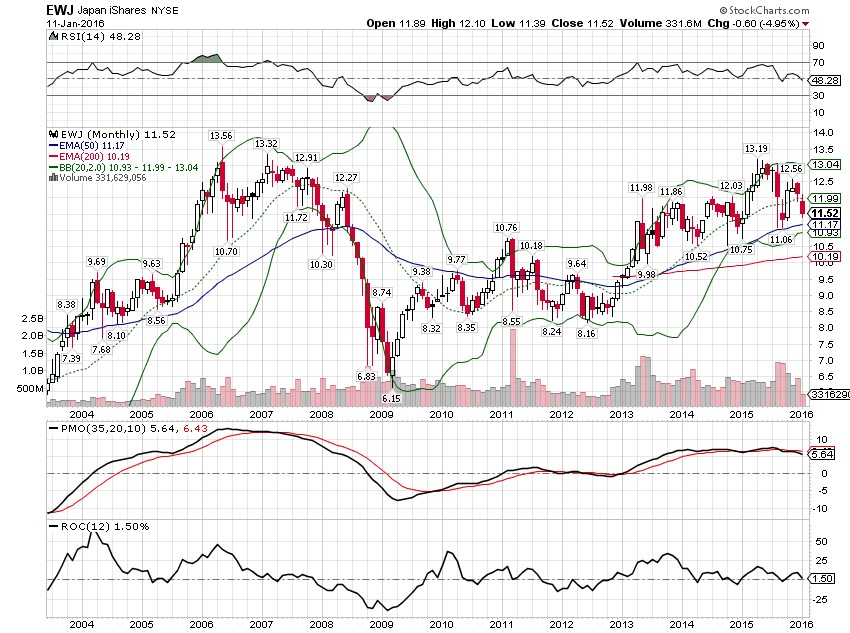
And lastly, I still believe Japan to be near the beginning of a secular bull market:
There is no change to the overall moderate allocation this month:
For information about other risk based asset allocations or any of our other tactical models, please contact Joe Calhoun at jyc3@4kb.d43.myftpupload.com or 786-249-3773. You can also book an appointment using our contact form.
Some of our tactical models, including the other risk based asset allocation models and our individual stock model portfolios, are included in our subscription service available through Seeking Alpha.
Click here to sign up for our free weekly e-newsletter.
“Wealth preservation and accumulation through thoughtful investing.”
This material has been distributed for informational purposes only. It is the opinion of the author and should not be considered as investment advice or a recommendation of any particular security, strategy, or investment product. Investments involve risk and you can lose money. Past investing and economic performance is not indicative of future performance. Alhambra Investment Partners, LLC expressly disclaims all liability in respect to actions taken based on all of the information in this writing. If an investor does not understand the risks associated with certain securities, he/she should seek the advice of an independent adviser.
Stay In Touch