
The headline Establishment Survey number disappointed at just 151k in January. The figure does not represent the actual amount of jobs gained, of course, since employment in January is typically about 3 million less than December. What that estimate represents is a combination of imputations about seasonality (comparing the actual change in the data set to the “typical” decline December to January) and at the start a stochastic modeling based on a non-exhaustive sample. That sample size is admittedly large, about 163,000 businesses and government agencies representing 623,000 individual worksites, but that does not mediate the necessity to refer to statistical processes.
The technical notes claim that the confidence interval for the CES is about 115,000 + or -, and that just for a 90% level of significance (1.6 standard deviations). So what the Establishment Survey just reported was in no way job gains of 151k but rather that January 2016 likely would have been between +36k and +266k had January been a “typical” and smooth month for employment. And even that interpretation is slightly misleading, since the confidence interval really only means that if the BLS ran the survey 100 times (polling a different 163,000 businesses each time), only 90 of those 100 are expected to fall in that range.
In short, there is entirely too much focus on the immediate monthly numbers – including when they are disappointing. Overall, the payroll figures remain as they have been; irrelevant for reasons that have to do with how they are constructed in the first place. There are any number of clues as to this statistical situation, but the easiest and most ready signal is basic common sense. Was January 2016 likely to have been a somewhat softer continuation of an otherwise robust employment condition unbroken by all that has occurred dating back almost two years now?
The fact that even the CES has clearly slowed in 2015 and into 2016 suggests that the true state of labor and payrolls did as well; what is left is to argue about is the degree of that slowing and from which point (“best jobs market in decades” or something much less than that) it began.
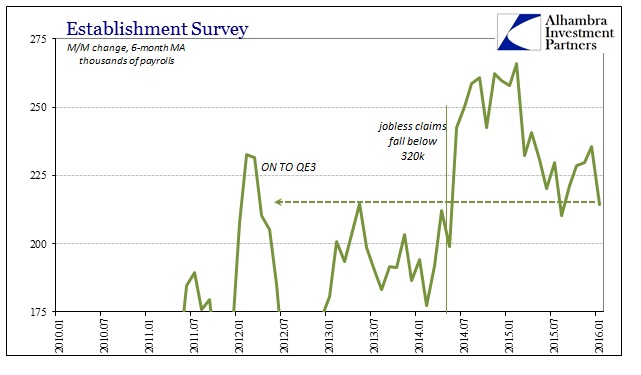
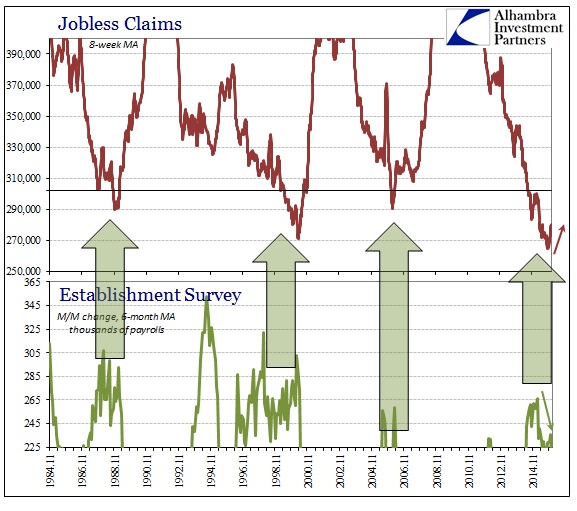
I still believe that jobless claims have been a “guiding factor” in configuring the CES (Establishment Survey) this whole time; up and now down. Jobless claims have plateaued if not somewhat reversed, which might suggest that the slowdown in the Establishment Survey at the start of last year was worse than currently projected (in terms of magnitude as well as starting point).
Regardless, the narrative about the labor market will survive despite how little it fits with the onrushing concerns of everything else:
U.S. employment gains slowed more than expected in January as the boost to hiring from unseasonably mild weather faded, but surging wages and an unemployment rate at an eight-year low suggested the labor market recovery remains firm.
I’ll address the “surging wages” later, but as for the unemployment rate cursory inspection would seem to suggest “full employment.” Ticking down to 4.9%, the unemployment rate is as low as it had been since February 2008. On that count alone, that would seem to confirm the FOMC’s shift toward “overheating” and the expectation of wage pressures; which is why they are always looking for them, but suspiciously never finding them. It takes very little effort, however, to completely undress the unemployment rate as a matter of its denominator.
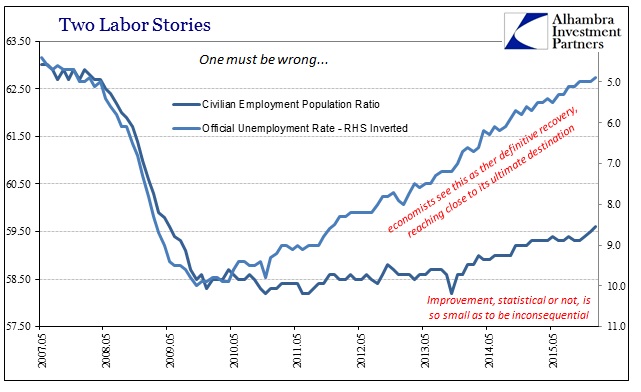
Because of the lack of wage growth, the fact that the unemployment rate is under 5% is meaningless, devoid of the participation context. In terms of overall population participation, the divergence is far, far worse.
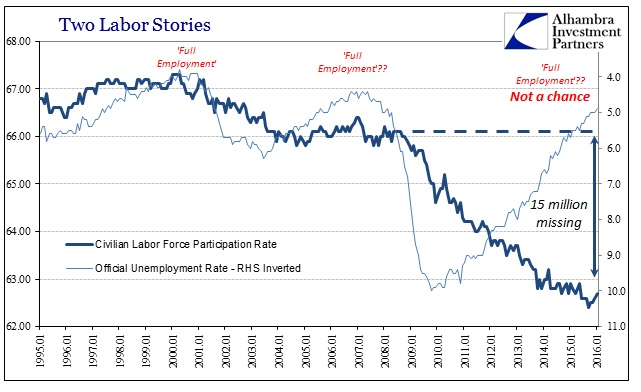
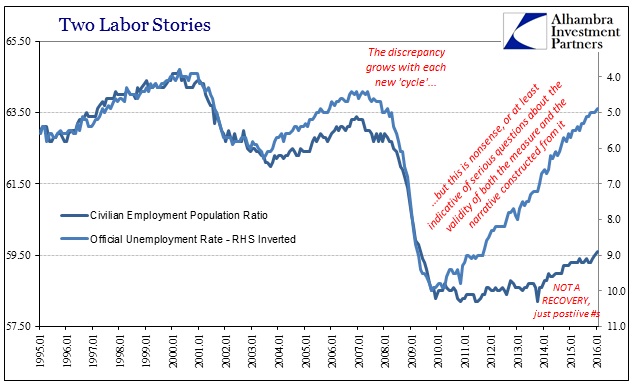
The “best jobs market in decades” did not even keep pace with population growth! Economists keep trying to assign Baby Boomer retirement as the primary cause of this major discrepancy but as you can see clearly in the chart immediately above, the participation rate, after having remained steady for four years, turned downward in June 2008 and has not stopped since. Either potential retirees picked the middle of the Great Recession and the sudden shift in their 401(k)’s as the perfect time to retire or there was a massive structural change in the labor dynamic – the Great Recession shrunk the economy (more precisely, the Great Recession revealed the shrunken foundation).
This is not to say that there is no retirement trend as there certainly is (it is overstated as the increasing participation rate of people over the age of 55 shows plainly), only that the labor statistics are not suited to address any of these issues but more so the shriveled economic system.
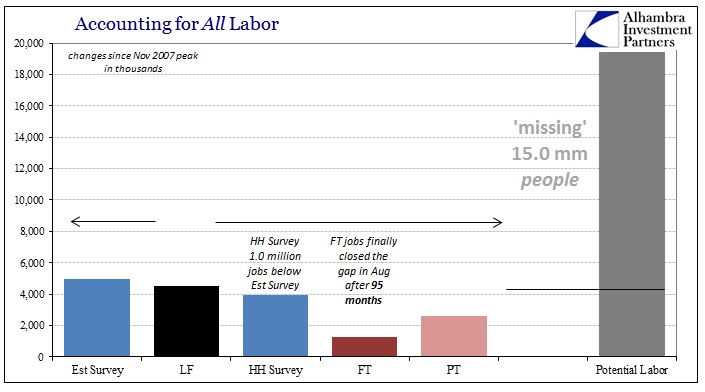
The scale of 15 million “missing” potential labor is just enormous, yet we are supposed to believe “full employment” and “overheating” expectations that somehow never seem to arrive. The focus on the monthly Establishment Survey noise is misguided enough, but especially if that, or any of the monthly figures, is taken as some kind of good evidence as to why the economy will withstand numerous and gaining stumbles. There is too much faith in these accounts in good times let alone just these sorts of circumstances. If the payroll report seems so far out of place with the rest of the economic accounts and really market expectations for the intermediate and near terms, and it certainly is, then further entrenching within it will lead to only greater confusion.
There just is no corroboration to the idea of the “best jobs market in decades”, and that statistical deficiency extends to the context and appreciation of the full labor report itself including what it actually is.
Stay In Touch