
The front month WTI futures contract traded as low as $27.27 this morning, a few dimes less than the low of January 20. Just three months out, however, the June 2016 contract is trading at $33.17 and up $0.43 on the day (as of this writing). Just two months further to August, that futures price is $35.11, up $0.53 on the day. That’s about $8 contango just in the five months. This sharp “hook” downward in the oil curve is the signal of liquidation, and unorderly at that.
Trading earlier this week certainly reflected that up and down asset markets, as liquidity strains were evident in widespread fashion. The effect in oil has been devastating, however, as those optimists still suggesting this is all about “supply” are finding the liquidations “winning” the curve battle. In other words, basic economics suggests that demand should rise at lower prices, even with the “friction” of supply, but the persisting liquidations and the cumulative effect has only been lower and lower. The oil curve, like money curves everywhere, is prisoner of a dark economic future.
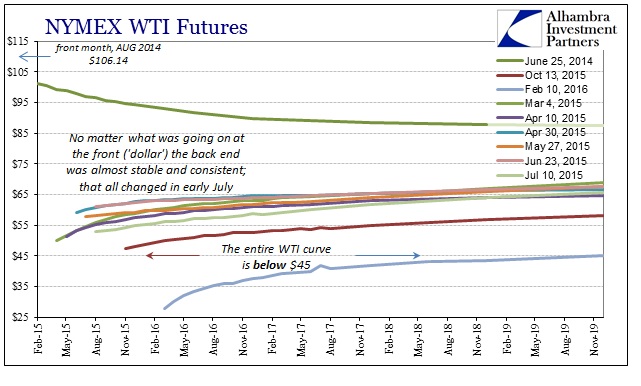
For much of last year, the idea of “transitory” was at least plausible for the longer maturities. After the first wave of the “dollar” and related oil crash, the WTI curve attained an almost simplistic consistency in that respect. As you can see above, from March until early July, no matter what was going on up front, the back end (later 2017 and out) remained largely undisturbed. The fact that this curve dynamic changed in early July is highly significant, representing the renewal of the latest “dollar” driven liquidations (run).
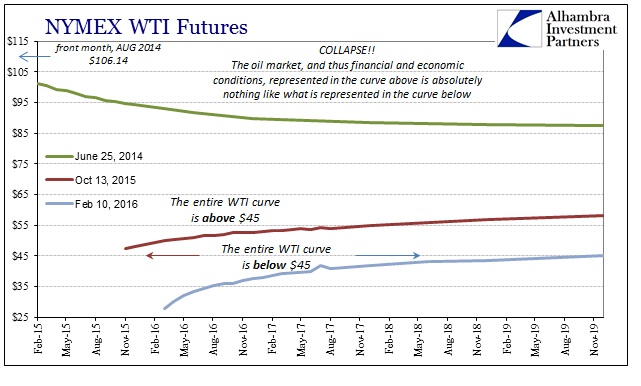
Whereas in the last Golden Week in China the WTI curve was relatively recognizable to those earlier 2015 conditions, with the whole curve above $45, it has since been pushed and squashed by the full weight of “dollar” and recessionary fears so that now the whole curve is under $45, front to back!
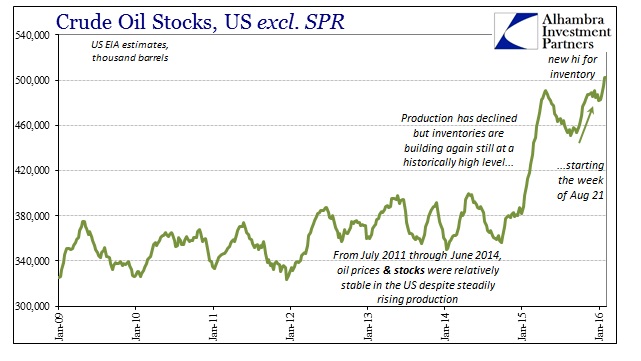
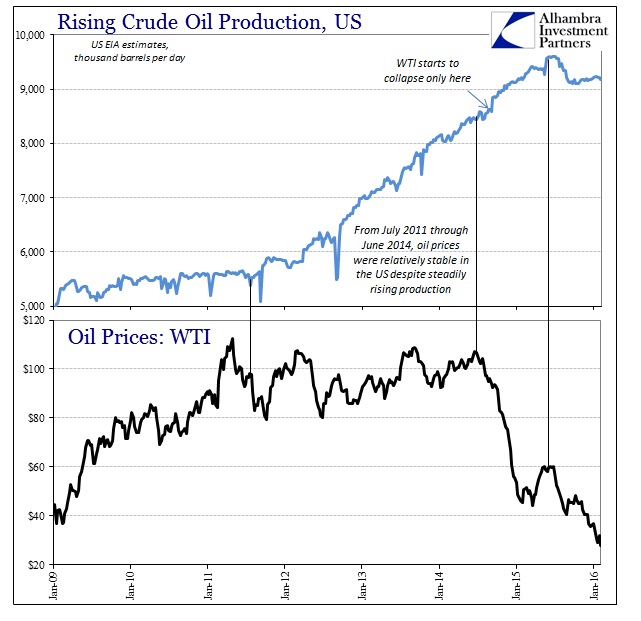
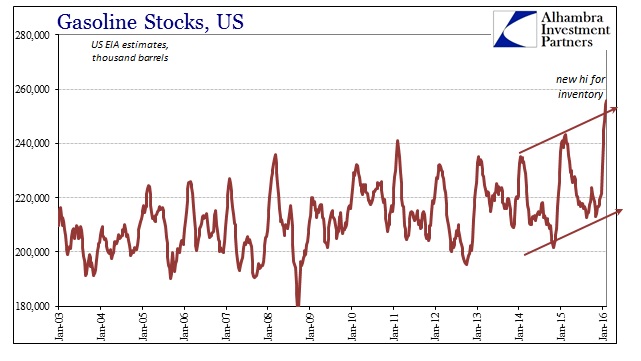
If the two parts of the curve represent somewhat different dynamics and thus fundamentally different outlooks, then the front side with the “dollar” has been the far more predictive end. The fundamental basics for oil were predicted by the liquidations rather than the plausibility of “transitory”, as oil inventories have run now to another record high.
That leaves only demand as the prime variable in both finance and the curve settings. In other words, the stubborn outer curve in the middle of 2015 was expecting the “supply glut” to itself abate leaving only, as Yellen predicted via the unemployment rate double fallacy, strong demand to eventually reassert pricing dynamics. That is why the outer maturities in futures remained around $65, as those believing in the recovery narrative we sure to make significant money by locking in deliveries for 2017 and beyond where they expected to sell oil much higher once more.
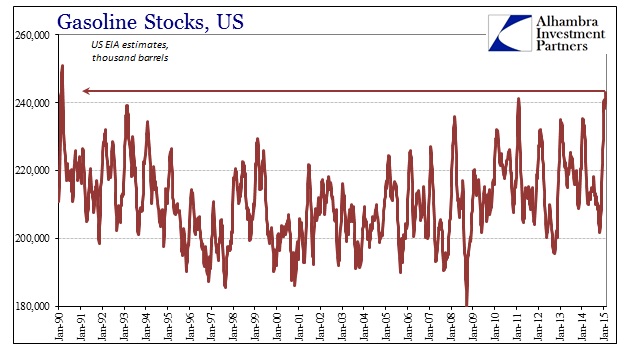
Instead, as oil piles up and liquidations roil the front end, those thinking Yellen correct at the back have thinned out with each weekly inventory build. And not just in oil storage, however, as gasoline inventory has started to pile up in record fashion (the last time gasoline stocks were this high was right at the start of the weekly series in 1990). In other words, “something” might actually be wrong with demand in a broad economic sense, thus pushing further and further into the future the plausibility of sustained higher prices (and further and further the implausibility of perhaps ever seeing the same curve that existed in late June 2014).
That means that those in the middle of 2015 looking for the “transitory” rebound are now faced with prospects of either cutting their losses and dumping out of their $60-$65 longer oil futures or re-hedging (and thus refinancing) their 2017 and 2018 positions for even farther out delivery. The whole curve collapses on the front end’s demand view – the “dollar” view.
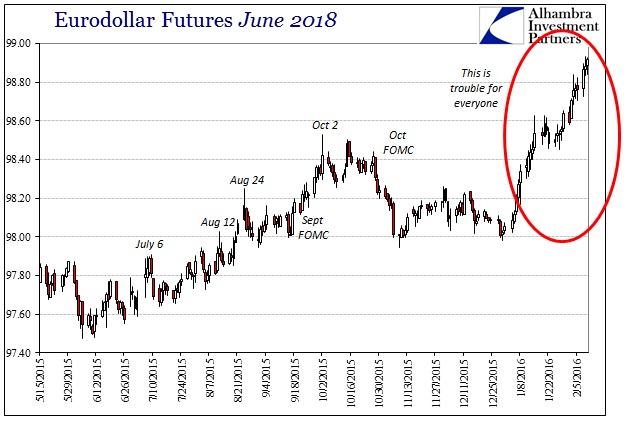
What’s truly alarming is that the “dollar” will not stop, as represented in several ways but particularly the eurodollar curve. Eurodollar futures have been actively and persistently bid since the start of 2016. That suggests nothing good for oil, of course, but what about next week when China wakes up again?
Stay In Touch