
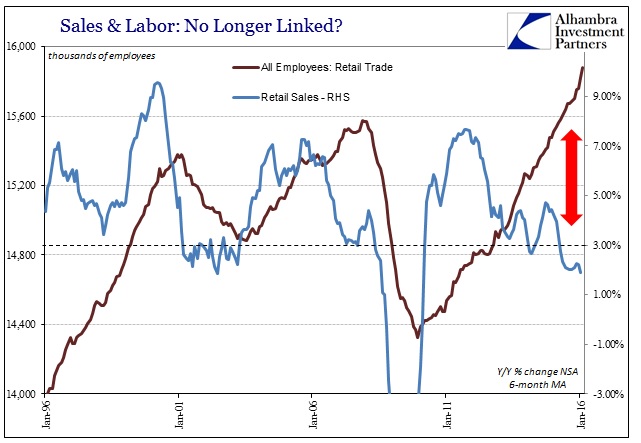
Going only from the conventional interpretation of the optimistic 242,000 in payroll gains Friday, it is still remarkable how more than one-fifth of those purported job creations in February were due to activity in retail trade alone. The monthly variation estimate for the retail sector (not including wholesale or transportation of goods) was an especially robust +55k even though the manufacturing sector is and has been contracting. The dichotomy is particularly striking since retail sales have also been noticeably weak over the past year, sales which suggest recession not the robust hiring.
Overall retail sales, including auto sales, have not been in the range considered of a healthy economy since the summer of 2012, yet the BLS has figured the usual straight line advance in hiring and employment. Since a minor curtailment in the middle of the 2012 weakness and slowdown, the BLS suggests that an enormous 1.08 million retail jobs have been created even though retail sales have lingered at dangerously low levels the whole time. Retail sales during an evident growth period should be rising by 6% minimum, not near or below 3%. In fact, 3% growth has been uniformly associated with recession.
In the late 1990’s, retail sales were growing routinely at 7-9% until the dot-com recession. As you would expect, from early 1998 until December 2000, the BLS reports that retailers added 865k jobs total, or about 25.5k per month. That is only slightly more than the 24.5k per month the BLS gives us for the past three and a half years of almost recessionary retail sales. As retail sales have sunk only further over the past year or so, the BLS instead somehow shows an enormous acceleration in retail trade jobs even better than the late 1990’s.
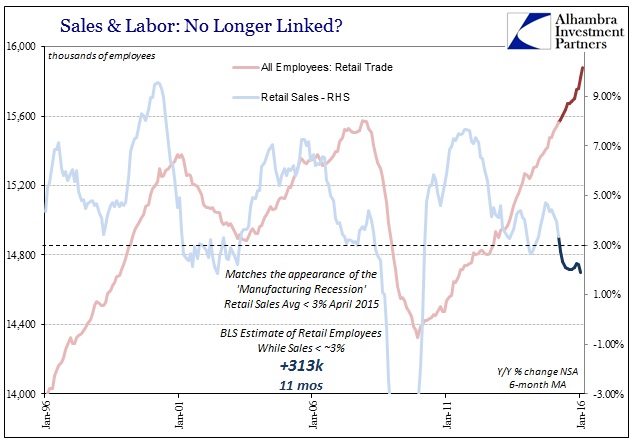
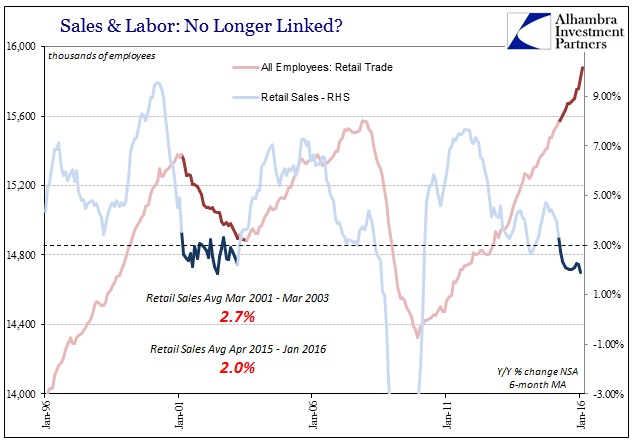
Starting April 2015, overall retail sales (again, including auto sales) fell below 3% on a 6-month average basis (meaning more than a one-month drop in growth rate) – and have remained closer to 2% than even 3%. In past cycles, that has meant initiation of contraction in retail trade employment and widespread recession. Not this time, however, as the BLS gives us a remarkable +313k gain (including February 2016) over the last 11 months. That equates to an astounding 28.5k per month.
By comparison, when retail sales fell to just near 3% in March 2001, right at the official start of the dot-com recession, the BLS instead estimates that retail trade jobs had already begun contracting from the month before (as retail sales sharply decelerated). Further, as you can plainly see immediately below, retail employment did not start expanding again until the middle of 2003 even though the recession had officially ended in November 2001. Retail sales, though, had continued to “scrape along the bottom” until March 2003, meaning that the BLS measure for employment in the industry very closely matched the 3% sales demarcation both inside and out of that cycle.
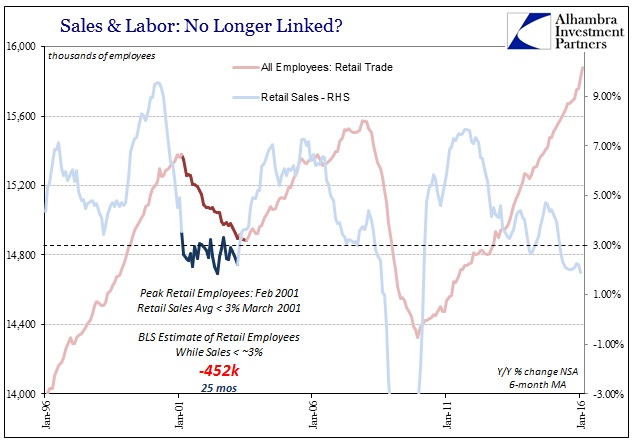
In very sharp contrast to what the BLS estimates over the past year, when retail sales were just 3% during that 2001-03 period total retail trade employees fell by nearly half a million.
The next time retail sales dropped, on average, to 3% was the middle of 2007 in a preview of what financial and market turmoil was going to suggest for the overall economy. Even though it was a small interruption, that 6-month period of reduced retail sales led the BLS to a small contraction in its approximations for retail trade employment.
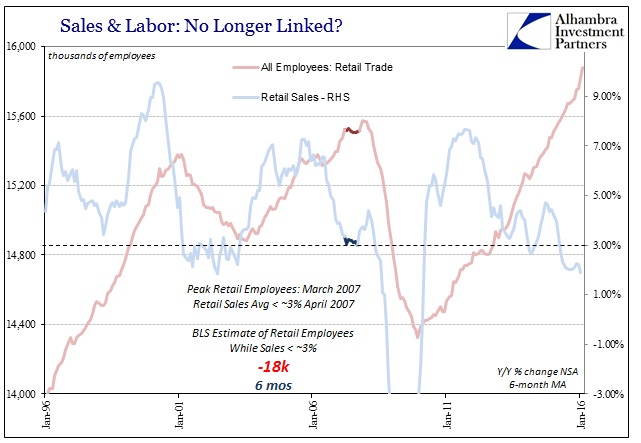
As soon as retail sales began picking up again on “inflation” in later 2007, the BLS shows an increase in employment but only after that close correlation to and then above 3% retail sales growth. Obviously, the Great Recession follows along also in a very clear relationship which only further raises the issue as to what the BLS is actually estimating of late.
On the sales side, the last year has been appreciably worse than the dot-com recession and recovery yet employment is moving in the exact opposite direction and with that strange intensity of late. Not only are employment figures showing a more robust hiring scenario now than the late 1990’s, the pace is significantly better than even the housing mania of the middle 2000’s. From April 2003 until August 2005, retail sales clearly accelerated, with the overall average 6.0% during those two and a half years (and the short-term, 6-month MA 7.25% by the end of them). It would make sense, then, that hiring would be sustained and relatively robust, with the BLS suggesting 458k total new retail jobs to go along with those increasingly better sales estimates.
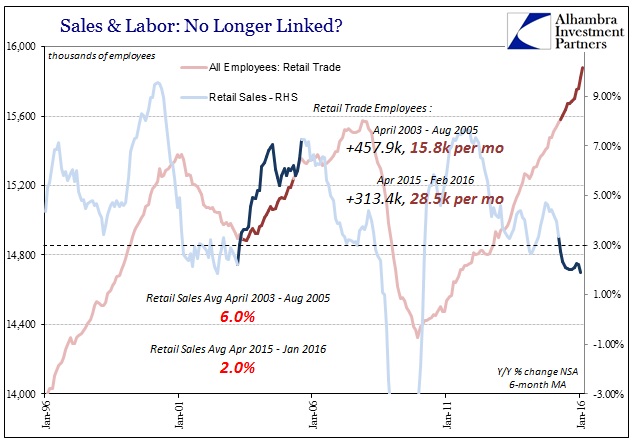
That means we have worse than dot-com recession levels in terms of sales over the past year from early 2015, but not the contraction in retail employment that went along with them prior. Instead, the BLS suggests that hiring is more robust now than during either the heights of the dot-com or housing bubbles even though sales are nowhere near those periods.
Even though the current string of retail sales data only dates back to 1992, the Census Bureau’s prior version of retail sales also shows inordinate economic trouble and contracting retail trade employment in this kind of sales environment at or below 3%.
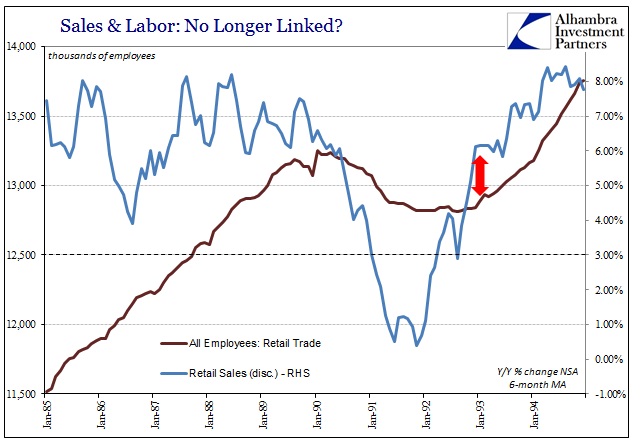
In the 1990-91 cycle, for instance, retail employment did not start to grow again until average sales were well-above dangerous levels almost into 1993. Retailers did not just want to see improvement but really continuous and constant improvement – common sense economics. Until 2012 there was a very robust, cyclical relationship between Census Bureau estimates for retail sales and BLS estimates for employment in retail trade. Since 2012, we are supposed to just accept that retailers are entirely more enthusiastic about hiring now than when sales were actually robust and sustainably so. Prior to 2012, the relationship made perfect sense; more recently, especially in the past year, the huge disparity suggests something drastically off in either sales or employment. Given the manufacturing recession and continued weakness in US import activity and overseas manufacturing, it is far more likely the employment numbers are highly overstated and by several degrees of magnitude.
This goes right along with the huge disparity in productivity estimates. In retail trade, the BLS’s continued increase in calculated, modeled hiring has the effect of dampening productivity to nothing, as if actual retailers would be so unaware in such sharp contrast to past behavior during a sales slump. Again, that leaves just two possibilities, as either retailers are no longer bound by sales or the BLS is highly overstating job growth in that sector. Since the productivity estimates are not bound to a single industry, we can reasonably assume that what the BLS is doing in retail trade might have been applied generally to their overall payroll reports.
I wrote Friday that the BLS biases are really showing, and that is most visible in retail trade (and manufacturing). Even if retail employment is not actually contracting now or has over the past year (which I think is a greater probability than not), it is quite likely that hiring is far, far less than the straight up trend currently presented by “seasonal adjustments” over-amplifying subjectively selected low variability.
Stay In Touch