
Industrial production for the combined January/February period in China fell to just 5.4%, matching the lowest growth rate of the past fourteen years. Only the January/February 2002 IP rate was lower, but that was a single data point giving way to the rising financialization of the late eurodollar period. In 2016, these decelerations are commonplace, determined, and have no end in sight. At 5.4%, industrial production matches China’s worst level of the Great Recession, that of November 2008.
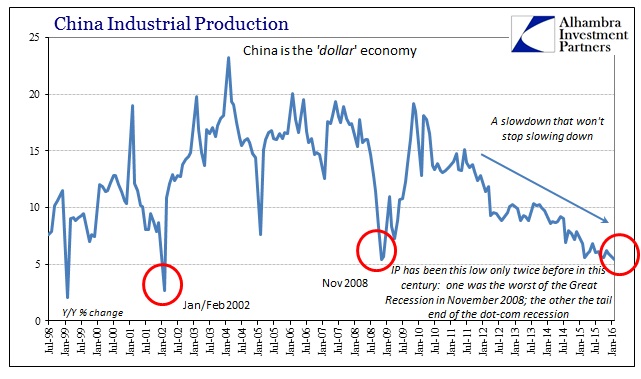
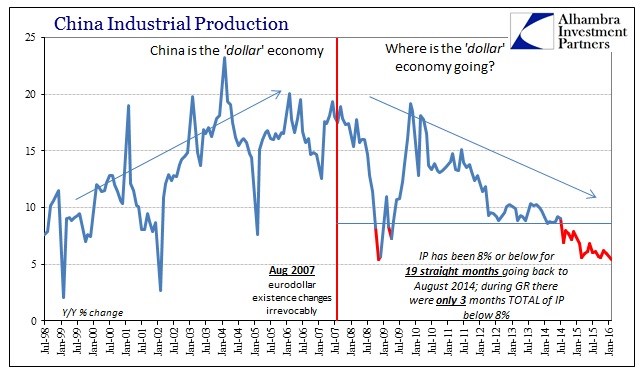
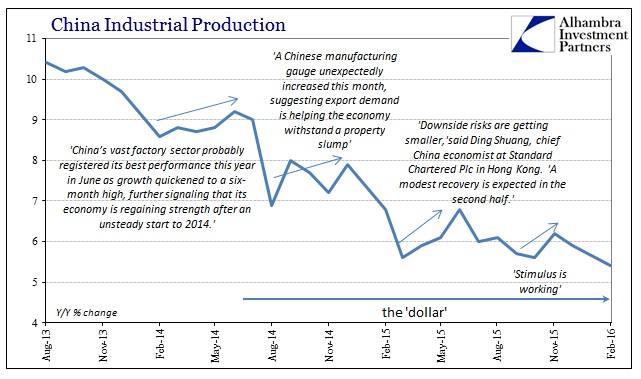
China’s industry has been consistently slowing down since early 2012, an unmistakable reference that is a global phenomenon. No matter how many times monthly variation ticks upward here and there (with each being celebrated by the mainstream and economists regardless of context) the overall trend remains intact. The slowdown just keeps churning lower and lower over time, to the point that IP has been 8% or below each of the past 19 months dating back to the summer of 2014. It is the accumulation of low growth that is the main concern as it only confirms that there will be no recovery, no return to the high-growth past.
That leads to inordinate problems because China is built on that past baseline. Overcapacity can be managed on a temporary basis (not well, but managed or offset) but put into the paradigm shift that we see currently and the whole mess needs to be reset – including and especially financial regimes that financed not just that overcapacity but that also required continued high growth to maintain price stability. From that view, the reluctance of the PBOC to do much more than try to manage the transition seems almost reasonable.
It isn’t at all unreasonable or unexpected to find industrial production in China at a historic low during the same months that Chinese exports collapsed. However as much this was all supposed to be about China managing Chinese imbalances, the close relationship between the continuous slowdown in exports (meaning “global demand”) and China’s industrial sector once again confirm that China is only the most visible representation of the structural deficiency in the whole global economy that is increasingly resembling cyclicality (a slowdown that won’t stop slowing down).
As I wrote back in September 2014 when IP broke below 8% for the first time, that was a profound disagreement against the then-dominant view (including that of the FOMC) that the world was heading toward recovery. The world’s manufacturing hub doesn’t hit a shocking slowdown right at the precipice of worldwide monetary success.
The pace of US imports from China is still about where it was at the worst of the dot-com recession, and about the same as the first two-thirds of the Great Recession. Global growth is a fantasy, only one that is more apparent now in Europe and Japan. The FOMC can make all the statements and proclamations it wants, but China and the rest of the world strongly beg to differ.
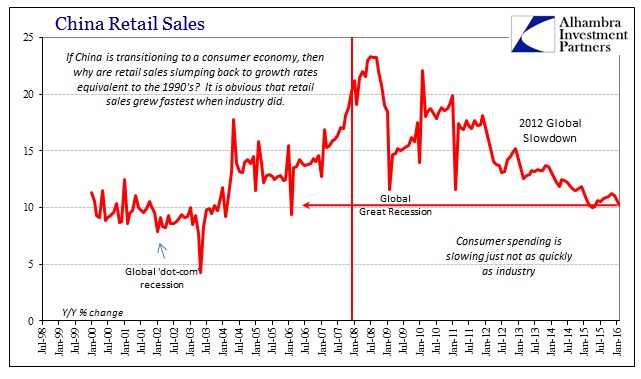
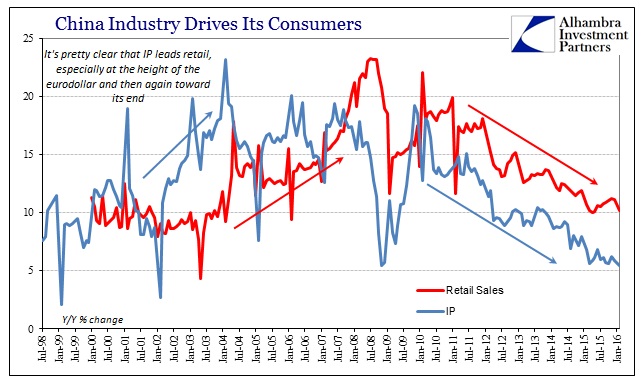
With industry faltering, the vast economic void was supposed to be filled by more vibrant Chinese consumers, though it is never really explained exactly how that works. Instead, what we find is what you would expect to find of an industrial economy slowly sinking the abyss. Retail sales had been seemingly divergent from industrial production in the latter half of 2015, with the growth rate accelerating from a multi-year low of 10% last April to as much as 11.2% in November. However, January/February’s estimate of just 10.2% shows that the only difference between industry and the Chinese consumer is one of time.
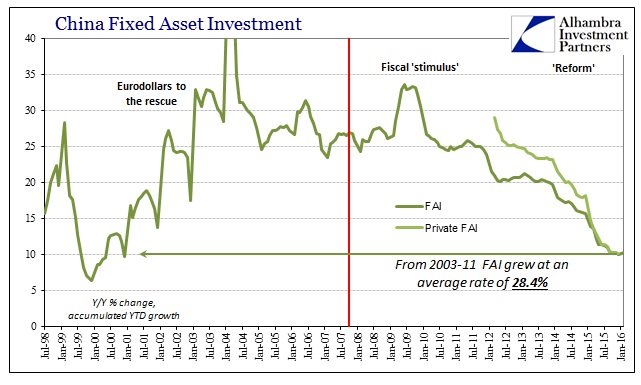
Perhaps the worst number of the main economic accounts was fixed asset investment even though FAI at 10.2% was marginally better than the 10% figured for all of 2015 (FAI is reported as an accumulated growth rate for each year). That minimal gain might confirm the worst interpretations of the surge in lending (and TSF) in January (as well as its radical slowdown in February). There were anecdotal reports even of the January financing levels that suggested Chinese corporates were participating in lending more along the lines of refinancing existing loan structures rather than taking on new projects. With FAI stuck near 10% in January/February, that seems an even more likely interpretation – despite the flood of lending (which started in December), there wasn’t a flood of productive investment which should have been visible by February.
Unlike past months, the first glimpse of 2016 offers nothing on any account to suggest even a minor turn; it was all bad all the way around. That remains the worst part, as this is unlike anything experienced before and it is being replicated around the globe. Economic growth, especially industry and manufacturing, just continues to sink month after month with no end in sight. The estimates for January/February in China show both new lows and that sort of lengthening or accumulation of depressiveness. After almost two years below what was once considered like recession (and, more importantly, reflective of recession in the global economy) “still slowing” is indeed the worst case.
Stay In Touch