
In July last year, the BEA reconfigured its GDP benchmarks to incorporate the results of the comprehensive 2012 Economic Census. That broad and deep survey found much less “recovery” than the BEA had originally anticipated through its system of stochastic predictions. It is believed that these statistical agencies of the government actually measure results in the real economy but in reality they are really just sampling, benchmarking and then chaining together calculated variance. These are complex processes that leave wide open the introduction of many subjective factors – including trend-cycle.
I do not object to the concept of incorporating trend-cycle imputations into any economic account; instead, I have very grave concerns about doing so in this “cycle.” Because the post-Great Recession period has been unlike any other, it is highly questionable to use “smoothing factors” that are based on all prior cycles. That is the primary limitation of all statistics since it is subjective at the very front by assuming that the current period or immediate future will bear relatively close resemblance to the recent or studied past. If the future charts an entirely new course, then that will subject these accounts to questions of veracity particularly when it will be revealed afterward that they have been overstating economic growth/strength to a significant degree.
That was the interpretation of the GDP revisions last year, which did not settle the matter but rather only raised more questions about possible inaccuracy and overstating that would likely continue. That was my major contention when recounting this problem last July:
The significance of this belated-admission is far greater than any semantics about recession or cycle. The 2012 slowdown, now finding its way to GDP, shows the same permanent alteration in trajectory as so many other non-adjusted economic accounts. That has great implications for our current circumstances, not least of which is how GDP in 2014 (and likely 2015) might be similarly overstating the post-slowdown economy. [emphasis added]
In other words, GDP was the last to figure out “something” had changed in 2011. There were already a great many indications that that was the case, and the fact that these other accounts and estimates had discovered this shift or inflection all in unison was far more compelling than the BEA’s continued reliance on its own subjectivity.
If retail sales, capital goods orders, import activity (China’s economy, Brazil, etc., etc.) all found the slowdown years before GDP, then it is reasonable to assume similar circumstances where the same divergence shows up again; i.e., right now. That is especially true when these other accounts are considerably worse now than they were in 2012 and early 2013.
In this new context, however, the generalized weakness is not surprising nor would it be taken as anomalous. The slowdown in 2012 set the trajectory for the elongated cycle, which is why I still think the recession started somewhere back then – but it doesn’t conform to all prior thought about how recession and contraction function. We know that the recovery portion itself has almost totally deviated from historical precedence, so it isn’t too far of a leap to assume that might be true on the other side of the cycle.
While GDP estimates for the past six months or more have dropped even without fixing trend-cycle, there are still reasons to suspect that it still overstates the true economic circumstances. Not only have these other accounts worsened (manufacturing recession and beyond) but we are again finding out in these parallel statistics their own backward acknowledgement of this systemic upward exaggeration.
The wholesale sales and inventory series undergoes annual revisions on April 1 of every year. The current revisions for wholesale sales were exactly as I described; a significant chunk of sales activity that was thought to exist now does not. The deviation into these new and concerning figures takes place in the early part of 2014, becoming serious for the months of that summer (“rising dollar”). In other words, as far as wholesale sales are concerned, there was a lot less to 2014 than originally thought, which again suggests that economists and policymakers were blindly following flawed data with obvious contradictions. And it makes 2015 much less than believed, only fostering more mainstream confusion.
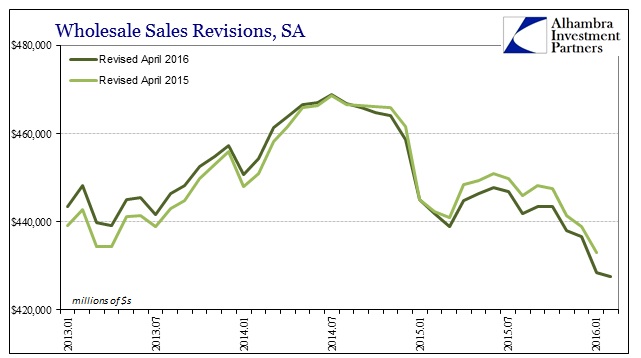
That is not the worst of it, however, as it was non-petroleum wholesale sales that caught the largest of the downward revisions (petroleum sales were actually revised upward by quite a bit, in general).
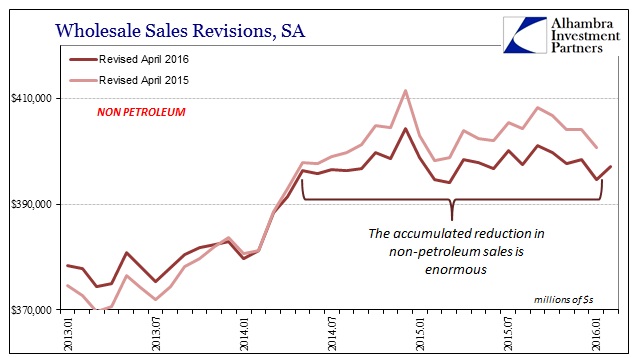
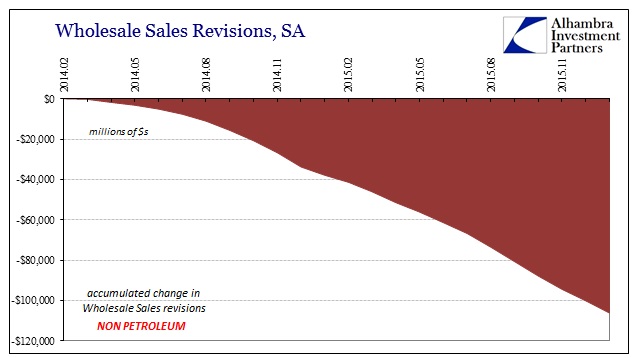
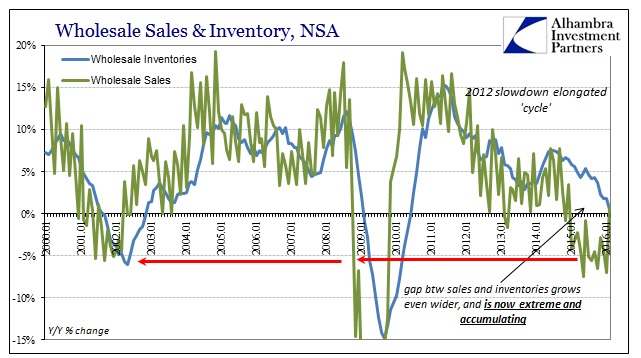
Where wholesale activity had been growing slowly (new normal) prior to the middle of 2014, it suddenly shifted and has been sideways to lower since. The revisions, again, were significant, as they erased more than $106 billion in non-petroleum sales cumulative over those nearly two years. Compared to both a true growth baseline and also the “new normal” baseline, it is perfectly clear that consumers spent less on energy and then also less on everything else (goods).
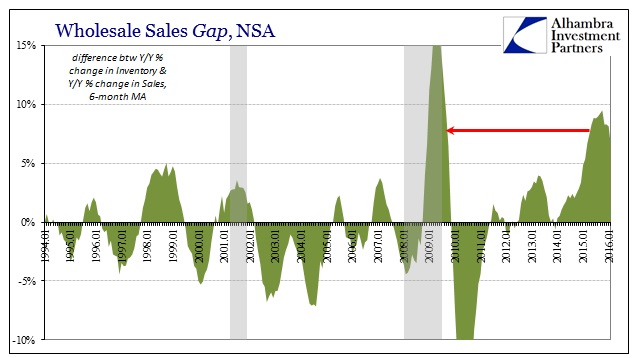
All that might not even be the most important part of the revisions. After all, we suspected all along as what was thought slow and steady growth had truly shifted to slow and steady contraction somewhere in just this time period. These revisions offer more evidence. Since sales have been reduced, however, you might expect that inventories would align. Instead, inventory estimates were revised upward (both petroleum and non-petroleum), meaning that the enormous imbalance to sales is even worse than we thought.
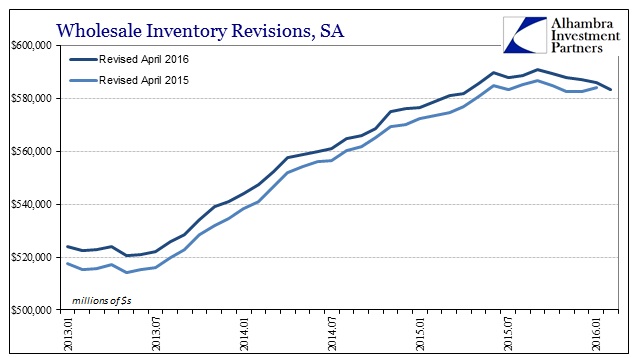
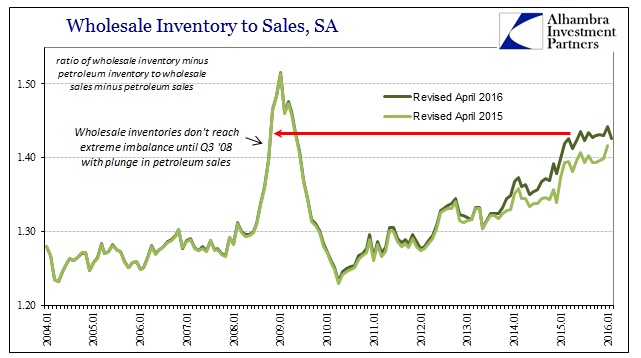
All that adds up to the “new normal” being lower and less stable than anticipated (and not just on the wholesale level or data, as similar revisions have been made elsewhere casting only more doubt especially about 2014) and the turn to steady contraction in 2015 has been even more negative. Only since August 2015 had inventory finally moved toward convergence to sales, meaning that for more than a year businesses were accumulating goods at a serious pace and quite likely because Janet Yellen forecast only good times based on the same flawed data subjectivity that is only partially and tardily accounting for the very good possibility this economy is nothing like anything ever witnessed. The data was overstating economic circumstances which allowed economists to do the same and extrapolate to a possibility that was never actually possible.
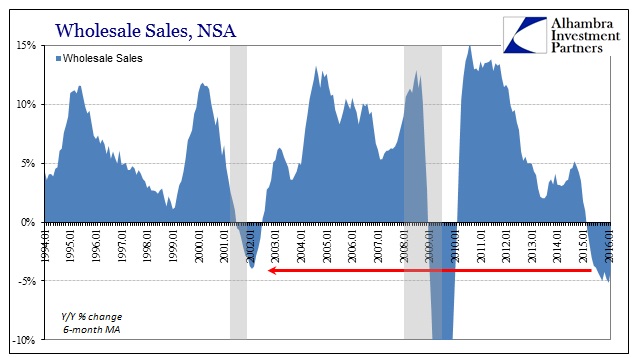
The current set of revisions shows more of the same as observed elsewhere, including the questionable improvement in February as compared to January. Wholesale sales rose 0.7% year-over-year, the first increase in 13 months. Undoubtedly, the 29th day of the month was a factor (the seasonally adjusted series fell month-over-month despite that unusual plus sign) as was, I believe, the general financial environment in February as compared to January.
On the inventory side, inventories were just barely positive year-over-year, the lowest growth rate since June 2010. It is the slowing in inventory that has kept the inventory-sales ratios across the supply chain from surging upward even faster. This behavior is consistent with a general and sustained slowdown, even though the inventory imbalance has achieved recessionary proportions. It is that imbalance that I think creates the worst case, where the slowdown continues and eventually combines with actual recession cyclicality.
A primary factor determining that potential will undoubtedly be conditions in the auto sector, as unsold stock is piling up in the wholesale level. This amounts to channel stuffing since car manufacturers count anything leaving the factory floor in their reported sales figures even if it ends up in some already-brimming parking lot by your local airport.
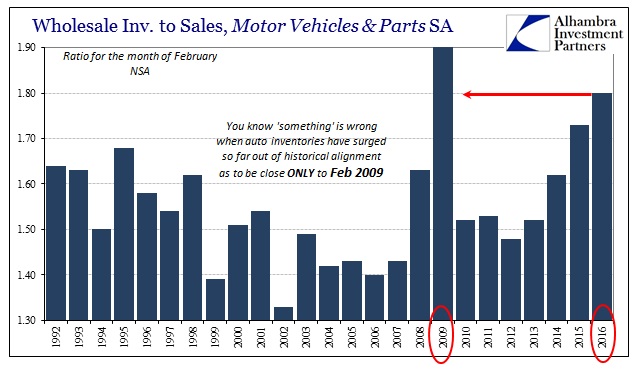
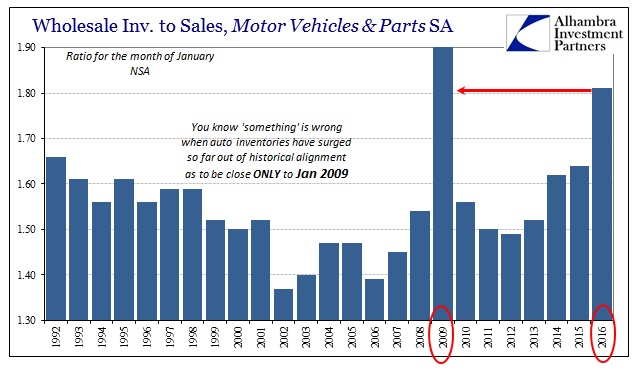
Taken altogether, the wholesale sales/inventory update with benchmark revisions further confirms three primary suppositions that have formed the basis of our economic analysis: that the slowdown is the baseline and it is continuing; that the possibility of adding recession to the slowdown remains; and that the years immediately following the shift to slowdown linger under suspicion for being overstated, especially 2014 and especially in accounts not corroborated anywhere else (payrolls perhaps someday rethink the best jobs market in decades?). The last of those three is the most egregious, as it supported expectations that were at the time highly dubious but even more so given that nobody ever wants to question what these estimates actually mean and how they are put together.
In any “normal” cycle, there isn’t much need to be so inquisitive and untrusting. However, when getting mixed signals across a broad survey of accounts (and we cannot leave out markets, like funding and commodities), let alone outright contradictions, it should lead to more doubt and then determined inquiry rather than increasingly entrenched, false confidence (“transitory”). A good part of the reason 2015 was “unexpected” is due to these factors and assumptions that were not really appropriate then, and much less so as various estimates are forced to catch up.
Stay In Touch