
To economists nothing about the 2000’s makes sense (a condition that has only grown worse in the 2010’s). At the same time productivity growth suddenly disappears, in its place is this incomprehensible “global savings glut.” While it has been tempting to dismiss these shifts as anomalies, even orthodox economists cannot just ignore them given the history of the past decade and the growing worldwide realization that “stimulus” suddenly delivers no positive effect at all. There is, as always, the mainstream itch to assign randomness as a non-explanation explanation, but it leaves further open the devastating charge that economists have only proven yet again they really don’t know what they are talking about, let alone doing.
Productivity, for example, did not just erode in the 2000’s as it is now estimated to have been about zero for years now. That just doesn’t make sense (and instead casts further suspicion that the employment statistics have been serially overstating the already disastrous recovery). In terms of NAIRU and the “natural” interest rate, the clear economic distortion you see on the chart above suggests only to orthodox practitioners that the “natural” rate may actually be negative and perhaps deeply so. To anyone not so ideologically committed, it is the clear signal of rot in the foundation. And that description is perhaps not quite severe enough since it infers undue passivity.
The Fed in QE3 and QE4 added $1.7 trillion in balance sheet expansion, or what is termed conventionally as “money printing.” Yet, for all that there has only been a curious divergence between inflation and unemployment. The latter has dropped fast, far faster than the highly optimistic expectations incorporated within the programs’ designs. No matter how much “stimulus” is added, however, inflation and GDP do not budge though the unemployment rate does.
Federal Reserve officials are paying close attention to these estimates now because the jobless rate is falling rapidly, down from 6.6% a year ago. Fed officials estimate the unemployment rate’s long-run range–which is akin to a Nairu–is between 5.2% and 5.5%. Officials will update their projections in March. Some of them are thinking about revising their estimates down, because they see unemployment falling without much evidence of inflation pressure building…
“Nairu is variable from cycle to cycle, much lower this time because of forces that keep inflation lower than typical,” said Allen Sinai of Decision Economics. His Nairu estimate is 4.3% and he doesn’t think it will be reached until the third quarter of 2016.
“Structural shifts in labor market since crisis push Nairu higher,” said Stephen Stanley of Amherst Pierpont Securities. His Nairu is 5.5% and he sees it being reached between April and June. The Fed, he said, is “already too late!”
That was all written in February last year, and shows just how little precision there is for all this “rules based” quantity theory. As the economy has only weakened, despite a dip below 5% in unemployment, monetary policy is left further isolated on all fronts. The far simpler explanation is that the economy just isn’t what economists believe it to be – and that goes deeper than just this “cycle”, reflecting once again those basic theoretical flaws. They can’t figure out NAIRU because their problems go far deeper and more intrinsic than that.
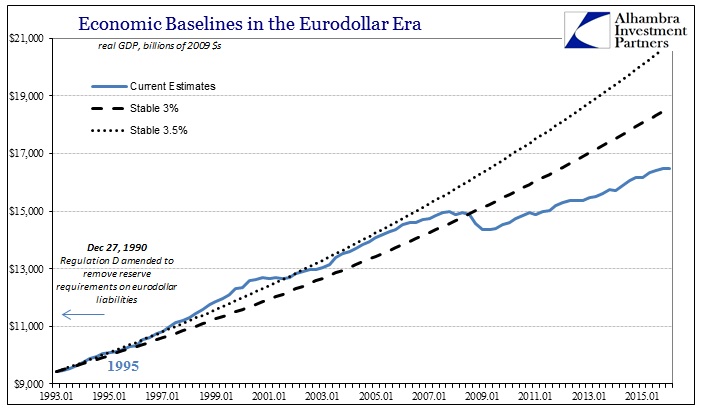
The entire idea of recovery itself has been betrayed by the past eight years. There is simply no way to describe this current condition as one, let alone further expect it to behave that way. This is by any count a radical departure from historical experience. Even the disastrous Great Inflation never turned into what increasingly appears a permanent rupture in the baseline.
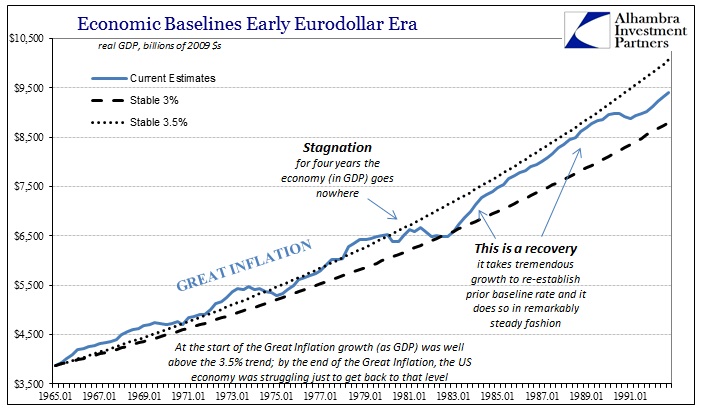
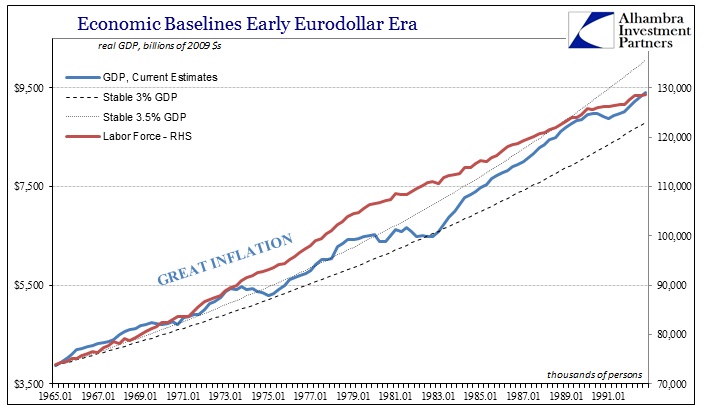
The Great Inflation began with steady and higher growth that quickly gave way to uneven and underperforming expansion. Where GDP had been above the upper baseline boundary (the 3.5% that I assign) at the start, by the time of the 1990 recession the economy could never regain that former level; that was the legacy of the Great Inflation. The chart above is in some ways misleading because it seems as if GDP growth in the 1980’s was insufficient. In truth, there was huge growth especially in the 1983-84 recovery but the hole left over from the Great Inflation was simply too much to overcome to push the economy all the way back up to its prior trajectory. Because it came close, however, it qualifies as a recovery.
The relationship between GDP and labor utilization was constant throughout. In terms of the BLS’s index of total hours worked, there is a high degree of consistency that you would expect with each cycle.
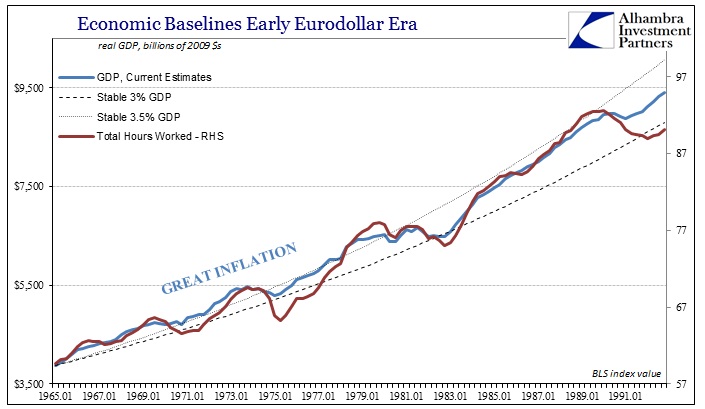
From the perspective of the labor force, you can even observe Bell and Mankiw’s contention for lower 1970’s productivity. The labor force as a whole expanded especially in the later 1970’s along with a surge in total hours. You can see why economists would be so infatuated with the idea of inflation, as it so often does accompany elevations in activity. It does not necessarily follow, however, that the relationship holds for all circumstances nor whether it works out the same when inflation is an intentional act (or just intent) of monetary policy. Because the labor force was rapidly expanding along with inflation at that time does not mean that the labor force and labor utilization will always expand with inflation (or expectations of inflation as is the central piece in the current theoretical framework).
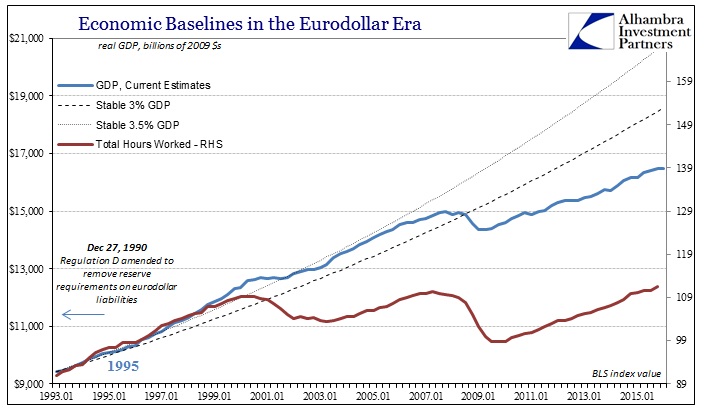
Some regard must be fall upon money itself, especially where monetary regimes have altered. The financial system should not be thought completely still while the world around it is erased and rebuilt time and again by technology and innovation. The monetary circumstances of the 1970’s are nothing like the 2000’s; and even less like the 2010’s. The labor foundation of the economy has reacted far differently than what is observed of forty years ago, and that point is due to far more than demographic shifts. Like GDP, it is absolutely clear the timing. Not only does the labor force participation start to drop, that itself is indicative of an even more nefarious development – declining labor utilization in the aggregate. It all dates back to the late 1990’s when economists were so eager to claim credit for the productivity “miracle.”
As I wrote Friday, the BLS’s Index of Total Hours should be retitled:
The change in labor utilization in the aggregate, in direct contrast to what the unemployment rate suggests, is so severe and obvious that the data series could appropriately be retitled as the US Index of Screwing Over American Workers.
Economists will argue that the US has been experiencing a recovery, and even a rapid one of late. According to the BLS, total hours worked do seem to point in that direction in the narrow view of an assumed business cycle. Through Q4 2015, total hours have increased by 12.8% since the trough of the Great Recession. The level that positive trend attained by the end of last year, however, is only 2% more than what the BLS estimates for the US economy at the peak (Q2 2000) just before the dot-com recession. In other words, there is barely more labor activity now at the end of 2015 than at the start of this century.
In the 15 years (minus one quarter) before that early 2000 peak, by contrast, the BLS figures that total labor output advanced by just more than 30%. Where the economy through productive labor utilization grew by a third in the last decade and a half of the 20th century, it has done nothing (NOTHING) in all of the 21st so far.
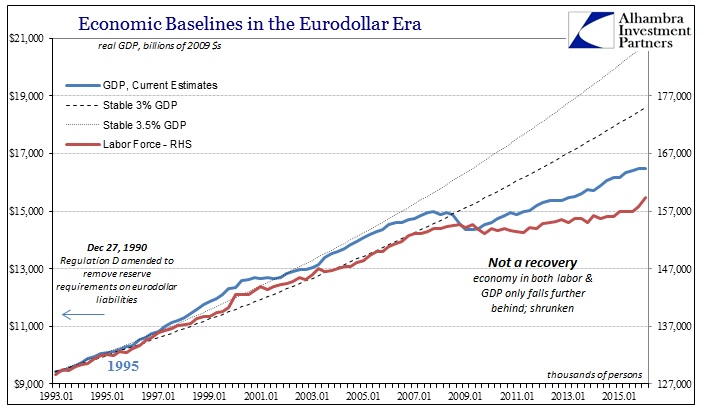
The issue really isn’t productivity at all; it is and always has been money. As should be painfully clear on the chart immediately above, the BLS figures for broad labor-derived output shifted before GDP. The difference was debt and debt-based money advance (globally), only now without any monetary “boost” on this side of the Great Recession GDP is forced down toward the level of actual labor and the real economic foundation. The economy didn’t mysteriously drop off after the Great Recession, it had been weakening underneath for the span of this entire century so far.
The only time in the past half century where economic growth in the US actually “makes sense” was in the early 1980’s – just after “demand” theory had been discredited and just before it made its unfortunately reappearance under the more distinct monetary banner (as opposed to the fiscal or Treasury-focused version of the Great Inflation era).
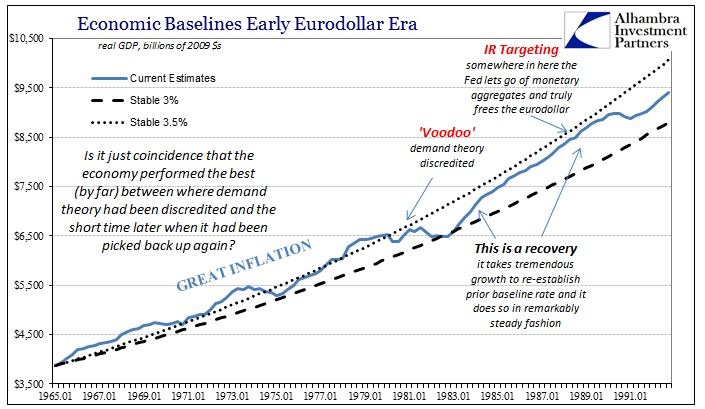
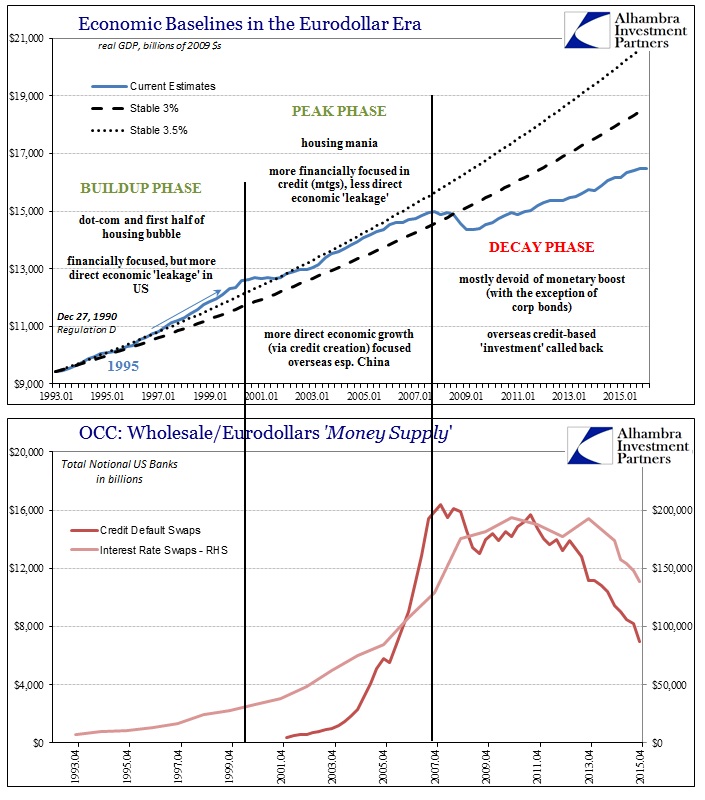
Not coincidentally, that was also the period between the eurodollar system’s first version that was almost exclusively devoted to global trade and its mature format that increasingly in the 1990’s departed that function for more broad-based speculation and pure volume (which is why there were asset bubbles all of a sudden).
Economists see only a generic “M” when in fact there is significant texture and nuance within “M” that can make all the difference. In just the past decade it has defined a panic that these same economists claimed was impossible and systemically depressed the global economy in ways that were not long ago thought unimaginable (“a hypothesis of a lasting increase in the rate of productivity growth”). The Fed went from being utterly unquestionable in its judgment and execution (late 1990’s), to merely passable in its handling of sudden failure (2000’s), to now broad-based doubts that it has the ability to offer anything constructive at all (2010’s). It wasn’t the Fed that changed, as the theory of QE is nothing more than the latest extension of its quantitative views that stretch back deep within its philosophical roots.
Americans have every right to be angry about this economic state of affairs, only they aren’t yet seeing it for what it really is – the money problem. The reason for this confusion is Paul Volcker; or, specifically, his reputation earned in 1980. Conventional wisdom declares that it was the Fed and economists that delivered that last real recovery starting in the early 1980’s when Volcker “defeated” inflation. That was never really true, but it certainly did not extrapolate into the reputation the Fed as an institution has cultivated for itself (cult being the correct term) in the decades since. We have been told that capitalism and free trade were instituted at that time but in reality what changed was only the method of interference; central planning and quantity theory shifted from the Treasury to the Federal Reserve. Since it was not an immediate transfer, it opened a window into which the economy could briefly prosper.
That systemic change also completed the eurodollar evolution, as what happened in it removed the last barriers for what the eurodollar could become. Like any good horror movie, the mature eurodollar started out in seemingly grand fashion as an enormous global benefit before turning ugly and then destructively so. The Fed was never in control, they just took credit for the first part when it all appeared to be so favorable. As Milton Friedman wrote of the 1920’s Fed, it is an undoubtedly institutional defect that lives on no matter the time period, so that, “in years of prosperity, monetary policy is said to be a potent instrument, the skillful handling of which deserves credit for the favorable course of events.”
What we find in the 2010’s is that it was never true – Alan Greenspan was no maestro, nor Ben Bernanke and his “savings glut” any kind of savior. They were just clueless statisticians taking their flawed models of generic “M” as some kind of monetary wizardry. The events that started in London on August 9, 2007, have left no doubt on that score. For perhaps its entire history, mainstream economics has had a serious problem coming to terms with money; now the global economy is proving it.
If this were just an academic problem arguing over who has the better models or statistics, this would be somewhat forgivable. But as is clear by the BLS numbers, and now GDP, there are real costs to every single policymaker being a devoted follower of this flawed, rigid approach. And unlike 1980, there is not yet any serious backlash that correctly identifies all of this as the cause. In fact, no matter how bad central bankers perform (and they only give us some variation of bad) they seem perfectly comfortable. They take everything in stride no matter how embarrassing it should be and incredibly offer only more of the same that didn’t work before while simultaneously claiming that it will at some point just start working (and not even bothering to explain the difference).
And throughout, the global economy only sinks further and further. The devastation and deviation in the baseline of any account, labor or GDP, is almost incomprehensible. Maybe that is their trick, that it is so difficult to actually grasp how much destruction they have allowed and nurtured that we just can’t appreciate it – it just doesn’t seem to be real. Like the eurodollar, the economy itself seems only increasingly imaginary.
Stay In Touch