
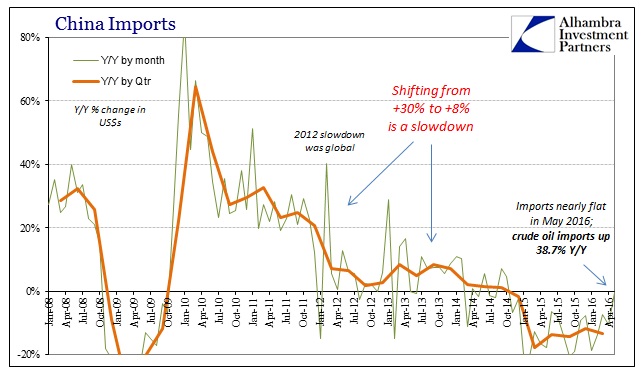
Chinese imports fell for the 19th consecutive month in May, but it was the pace of the latest decline that has stirred (yet again) so much optimism. Year-over-year, Chinese imports were down just 0.4%, beating expectations for a 6% drop. From that, as you can guess, the media is awash in commentary that “stimulus” is working, meaning the recovery is once more being fully extrapolated from another single monthly data point.
Geographically, imports fell sharply from ASEAN countries (-14%), European countries (-5.2%), and even the United States (-12.8%) and Australia (-19.3%). Offsetting those declines were Hong Kong (+242.6%, showing “capital outflows” are back as expected when expected), Vietnam (+15.1%), and Brazil (+17.3%). Where the mainstream sees recovery out of all that, a good portion of the improvement is crude oil. Total crude imports were up 38.7% from May 2015 as China has taken to “stockpiling.”
“The year-on-year growth is massive at 2.125 million bpd from a very low May 2015 base … driven by demand from teapots and crude stockpiling,” said Virendra Chauhan, an analyst at consultancy Energy Aspects.
As noted before, the buildup of China’s crude inventory is financial rather than economic. The Chinese are taking in oil rather than being repaid in “dollars” primarily from OPEC borrowers, converting their virtual currency liabilities into a hard (and liquid) commodity while at the same time making it appear that the internal Chinese economy might actually be recovering.
An actual recovery would be difficult to achieve on these financial terms alone, especially since the flow of oil into China is effectively stripping its clients’ abilities to fund and buy its exports. Chinese exports in May 2016 fell 4.1% Y/Y, and are down an enormous 7% YTD with almost half the year completed.
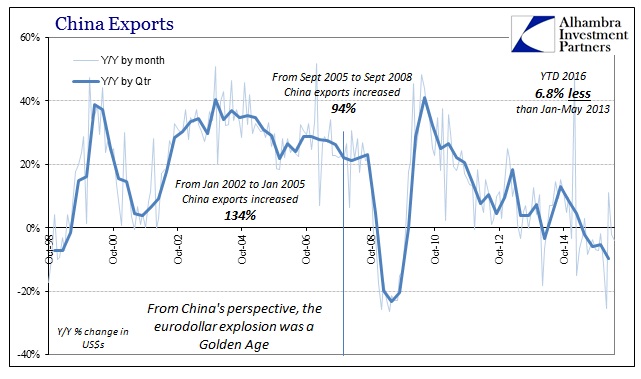
The Chinese government essentially admitted that the export engine is not about to restart anytime soon, meaning its own assessment of the global economy remains dour and being forced more so each month. After initially forecasting (hoping) for modest 3% export growth in 2016, following a 2.6% drop in CY2015, PBOC models now suggest -1% export activity this year. Not only is that a significant reduction in its projection, it forces the official sector to begin considering negative exports for a second straight year.
In broader terms, the Chinese government declined to offer a trade target forecast for this year. Last year total trade was expected to rise by 6% but ended up falling by 7%, suggesting that no matter how much oil might be influencing monthly totals it is not being used as yet another optimistic outlook at least for the official sector. With total trade trade also declining potentially (very likely) for another year consecutively, it only adds to the already high strain of global overcapacity (both merchandise production and, perhaps more importantly, financing of it).
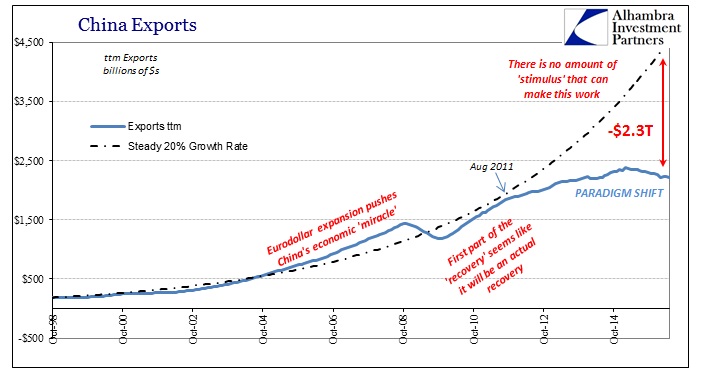
In the last 12 months ending with May 2016, total Chinese exports were $2.22 trillion. In the 12 months ending May 2015, exports were a cumulative $2.35 trillion, a 5% reduction across an entire year’s worth of global economy. But in terms of Chinese capacity, the industrial baseline that remains relevant despite the consistent slowdown, the distance between reality and health grows exponentially. The 20% long-term baseline (as shown above) suggested $3.8 trillion for exports (ttm) last May, leaving an enormous $1.45 trillion “gap” or global economic reduction that is the center of Chinese economic and financial struggles. As exports have only contracted since, the baseline suggests Chinese exports “should” have been now $4.6 trillion through May 2016 but with less actual global “demand”; the “gap” now surges to $2.33 trillion.
Plus or minus misses the point; the central economic factor is the distance between economic levels and what they “should” be given cyclical expectations (that are only further reinforced even now).
Among the methods the Chinese have apparently chosen to deal with the financial fallout (“dollar”) of this paradigm shift/reduction in the global economy is to drastically redistribute global oil flow. This is nowhere near the same as recovery, even though in one narrow sense (and for one month so far) the statistic might seem to suggest it. Even if you think imports do indicate at least some bottoming for the internal Chinese economy, the export side continues to leave no doubt about the undeterred weakness in the global economy now stretching into its fifth year.
The narrative problem is entirely orthodox duality – as if the economy were presented only a binary choice between expansion and contraction. Because of assumptions of cyclicality rather than trend, economics has decided that if any economy is not in cyclical recession it must be in expansion, even if that expansion is slow and unusual. Because of this set of conventions, any statistic that is not immediately recessionary is framed as evidence against recession and therefore in favor of expansion. There is too much emphasis on the plus signs (or, in this case, the near-zero negative) that misses the primary problem as it relates to trend.
The end result is economists that don’t know what to make of what they assume is unusual, such as the rapid, sudden, and extreme importation of crude oil (or the further masking of “capital outflows” via Hong Kong, something that shouldn’t be taking place if China really was on the doorstep of recovery). China’s trade struggles are our struggles, not just as reflexive spillovers of its own contradictions but far more so as reflecting the global economy as an inescapable whole.
Stay In Touch