
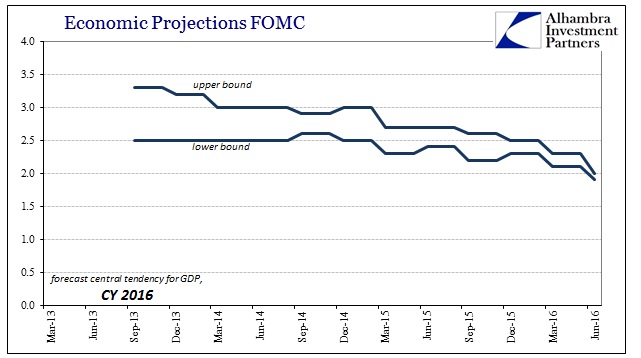
The June FOMC meeting coincides with the quarterly update of the Federal Reserve’s modeled economic and policy projections. As usual, the economy forecasts have been cut for both 2016 and 2017. The upper bound for the “central tendency” of real GDP in 2016 was 3% in the modeled calculations made at the end of 2014, those that saw no fallout from the forming oil crash and introduction of “global turmoil” (including the dramatic events on and around October 15, 2014). By last March, only 0.3% was cut from the upper bound estimate in anticipation of “transitory” factors such as oil prices.
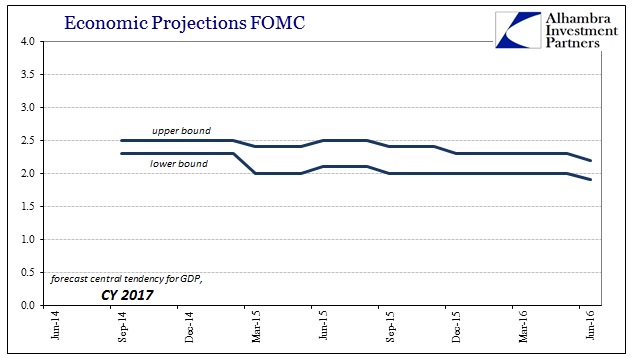
The events of the summer and further to start to 2016 have changed the forecast complexion. As of June 2016’s update, the upper boundary for the current year’s central tendency is now just 2%, meaning “global turmoil” has cut 1% (so far) from anticipated growth (0.7% at the lower bound). The reductions to 2017 are just now beginning, though from a much slower base estimate. The upper boundary for next year was never set above 2.5%, recognizing at least the long run problems in this “recovery.” Taken together, these projections show that despite great enthusiasm in 2014 there will not be a “lift off” at all, only (at best) more uneven malaise.
In other words, the Federal Reserve has very quietly given up on at least the GDP reflection of what “full employment” should bring – thus once again calling into question the whole idea of whether there is anything like full employment now or in the next few years. It is not just the projections for GDP that betray the former narrative, however, as the largest reductions have taken place in the modeled trajectory for the federal funds rate.
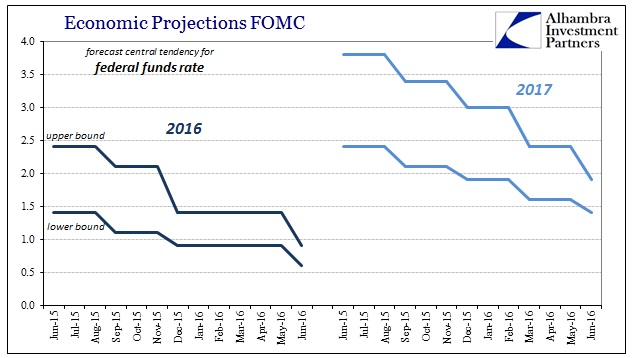
The revised projections are truly astounding; in the space of just one year, the statistical estimate for the upper bound of the federal funds rate went from forecasting 2.5% in 2016 to just 0.9%; in 2017, though the dispersion in the central tendency was wide, the upper bound projection dropped from almost 4% to less than 2%, the equivalent of almost 8 fewer quarter point rate hikes. The lower bound estimate for 2017 is less dramatic, but still significant in figuring 4 fewer quarter point rate hikes.
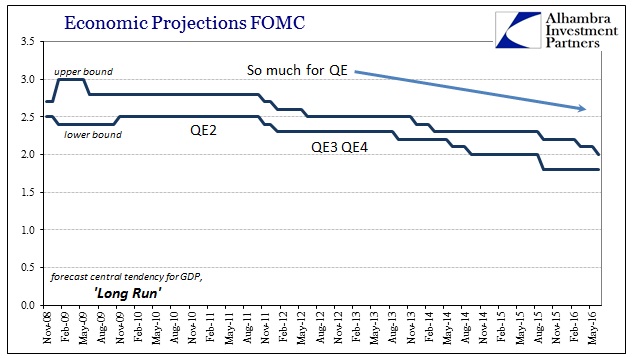
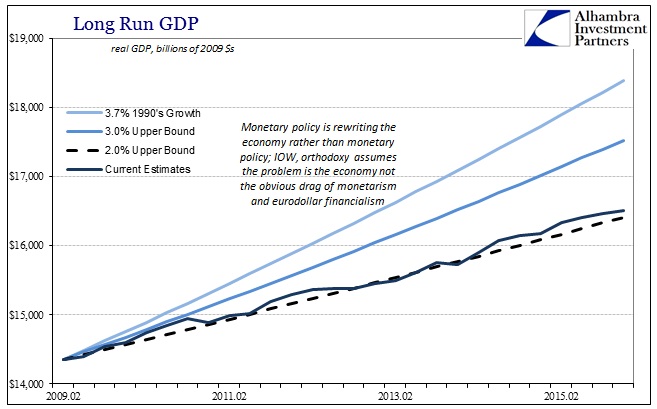
That all suggests the exact economic content of potential “overheating” due to full employment has been downgraded by the not-so-transitory dollar to much, much cooler. This is also reflected in the further reduction in the modeled central tendency for long run real GDP.
It is the most distressing element of the Fed’s models, as it essentially makes the claim that no matter how much and how long the economy underperforms it is an endogenous problem that monetary policy can’t fix. In other words, the more the regressions “write down” the economy as the BEA’s estimates fail to suggest recovery, the more the math blames the economy rather than anything else – like monetary policy or the monetary environment in general.
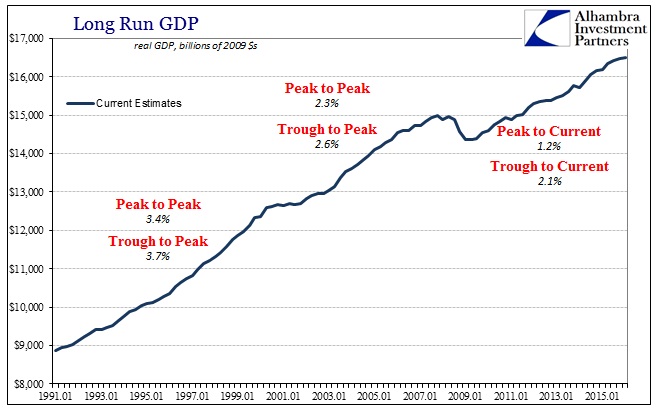
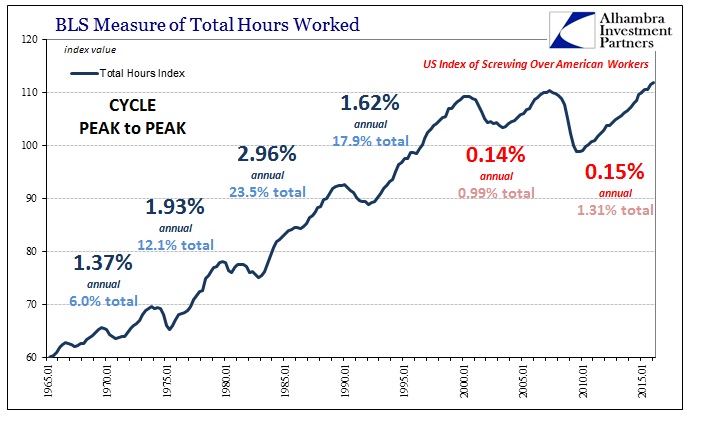
Measuring actual GDP growth from the trough of the Great Recession, you can observe this re-pegging of the long run growth trajectory as function of actual results rather than an outcome consistent with all prior business cycles.
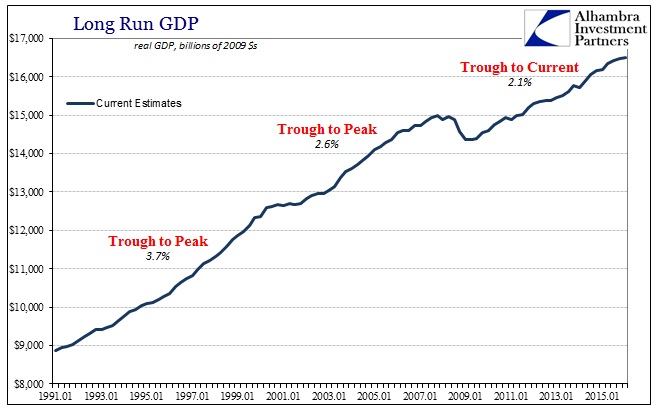
If we instead view GDP (correctly) peak to peak, there is no doubt that the models are still being overly optimistic about what they assume is the long run tendency.
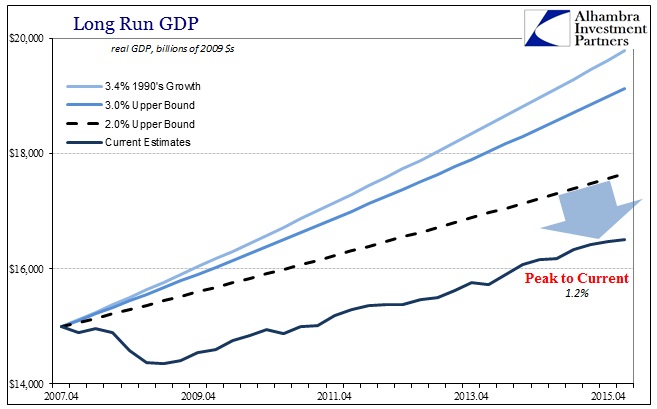
It would take a real bout of “overheating” for GDP to actually climb to the much reduced 2% upper bound that properly includes the Great Recession. Since the FOMC is not projecting that to occur despite its rhetoric, its current long run estimates will have to be marked down significantly again and thus really raising the question as to what they are actually measuring.
From this perspective we see the real problem, namely that the recession itself was unusually large while the recovery following was unusually weak. The fact that this asymmetry has extended almost to a completed seventh year is what is forcing the Fed to come to terms with the possibility that no matter how glowingly and forcefully they speak of the economy it will never achieve an actual recovery. These models suggest a far different “full employment” scenario than what is and should be commonly perceived. That much we know by any direct comparison with prior experience of full employment, including the relatively weak recovery in the middle 2000’s.
The Fed’s math, then, is being forced to admit to a rather dire outlook wholly unlike the far sunnier disposition that policymakers frame for their public comments. To find that full employment now is nothing like a full recovery is a contradiction in common sense; in orthodox economics, permanent shrinking isn’t considered a violation so long as the given cause is believed unrelated to orthodox economics. In other words, the goal of ZIRP and QE was to deliver a labor recovery and they have so long as full recovery is completely redefined outside the unemployment rate. To use a football analogy, the Fed’s economists have convinced themselves that the field shrunk due to circumstances beyond their ken and so a touchdown is scored for them simply by crossing the 50; and not just any touchdown, but the winning one.
The rest is really that simple; a lot of math to reduce the standards such that Janet Yellen can describe her familiarity and success with only half the football field. As the weakness only continues, in not too much more time it is highly likely that her goal line will have to be pushed again to her own 40.
Dramatically sinking projections for the federal funds rate, however, shows just how much trouble the real world injects into these reduced standards. The real economy populated by real people cannot simply ignore this lost capacity and activity, so no matter how much the Fed claims full employment at a sub-2% long run tendency it holds no actual meaning. If it did, the FOMC would be getting their 8 to 10 rate hikes over the next couple years with ease; the fact that they can’t even forecast that much now is simply more evidence of the fraud of QE and the manipulations that are being used to cover it.
There is some good irony to appreciate with all of this, as I suggested a few days ago in terms of rational expectations theory. To make that malignant theory believable meant the Fed opening up to enhance its transparency and credibility. Thus, they now have to readily provide us with internal evidence that their own calculations contradict what they say in public. To do otherwise would risk going back to the secrecy format that prevailed before the 1990’s. You have to believe they really, really would rather not show the outside world they have no idea what they are doing, but they prevent themselves from burying it by their steadfast devotion to other nonsense.
So they are left only with the obfuscation of language: full employment, overheating, transitory, strong, the economy is showing signs, etc. None of those words actually apply in any manner consistent with their actual meaning, and the Fed’s own models show it.
Stay In Touch