In a regime where math acts as money, there are a few major potential chokepoints where shifts in math can become systemically important difficulties. In 2008, the most visible example was in repo haircuts, but the most devastating to the financial system certainly fixed income (MBS, in particular) correlation. The system could not survive rising correlation because nobody was prepared for it, not just in the overly optimistic projections that went into the original pricing of illiquid securitization tranches (especially the super seniors) suddenly being recognized as such, but more so in how illiquidity in CDS pricing had a direct and devastating impact on correlation trading that even the most bearish participant didn’t expect.
I don’t want to diminish the importance of repo haircuts or correlation implications, but those pertain more so (so far) to the “last one.” In the years since the crisis, it seems that volatility has assumed a more central mathematical role. Frustratingly, it has done so in almost exactly the same fashion as correlation had leading up to 2007. The conventional perception about central bank policy including QE is that it has all been a combined effort of “money printing”, and thus for asset markets there is plentiful liquidity which can be extrapolated into expectations of very low volatility. In some circles, this has been called the banishment of “tail risk.”
Volatility has a role to play in math upon balance sheets, especially in measures like VaR. Even indirectly, volatility is a central premise of not just asset pricing but funding conditions and basic balance sheet construction (and then fortification). Thus, if it were suddenly found that volatility estimates, like correlation in the mid-2000’s, had been too optimistic and systemically so, the adjustment in aggregate terms to even a slightly more realistic volatility organization might be excessively harsh.
Some of that is simple self-fulfilling prophecy very similar to any 1930’s-style bank run: depositors begin to think a bank is shaky, start to withdraw their funds and pretty soon the bank actually is shaky; market agents (derivatives) begin to believe volatility is too low, start to act in that fashion and pretty soon market prices gyrate so that volatility is no longer low. The key at that point is really the same as it might have been during the bank runs of the 1930’s – currency elasticity where the central bank steps in with actual printed money so that banks, in theory, could withstand any determined waves of withdrawals and by the very act of doing so convince its depositors that it is not shaky (ending the run). In the 2010’s and renewed questions of volatility, central bank policy is again central to either stamping out the “run” or proving its suppositions.
If “something” did actually change with regard to asset prices and volatility assumptions in the middle of last year, and I think it very clear something did, then the “global turmoil” of the past year or so is but the last step in that process of re-evaluation. It starts (or started) in the fundamental elements of the real economy, where the stimulus of “money printing” has failed on every count. In other words, if “stimulus” is itself divorced from expected economic effects, low volatility assumptions in financial terms are immediately questionable. Monetary policy for the sake of monetary policy isn’t a basis for ultra-low volatility, it is the cover that is supposed to lead the way to the path toward a fruitful and sustained recovery – which is the mechanism for actual low volatility.
Just a week after the August 24 global liquidations, only two weeks removed from China’s sudden and misinterpreted “devaluation”, I wrote:
Since volatility perception is “running” this process, I don’t think it ends until a fundamental change is made; either the economy starts living up to the promises or liquidity subtracts until prices actually reflect that it won’t.
It may sound strange to the 2016 ear, but that is actually how it is supposed to work; markets as discounting mechanisms. They have been following the myths of central banking for so long, estimates and math-as-money had been set more so on perceptions of what monetary policy is supposed to do rather than what it actually could do. Stock prices are perhaps the most extreme example especially in response to QE3. Equities shot up in anticipation of full recovery while the economy, at best, ended it and entered a prolonged slowdown (now contraction). In almost two years of increasingly volatile sideways trading, stocks are still trying to reconcile the myths of central banking to the more discernable failures of it all.
Funding markets are too, but they are undoubtedly much further advanced in the process. So long as the economy remains far from a growth path, regardless of specific cyclical circumstances like recession or not recession (there is too much emphasis in the mainstream especially on the latter), the funding/market re-evaluation must (can) only continue. Again, this is how it is supposed to work.
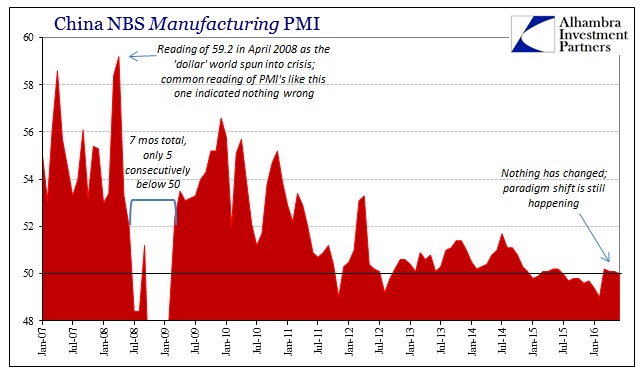
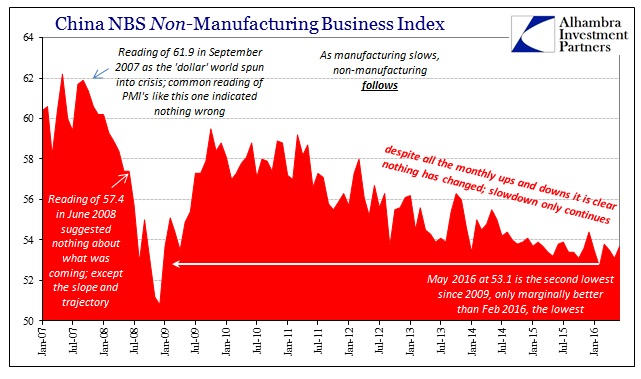
It is in this context that economic accounts or measurements like PMI’s are best interpreted. China’s manufacturing PMI “fell” back to 50.0 again in June, that magical dividing line supposedly just barely on the right side of growth, when in reality it was no different than the 50.1 in May or even the 50.8 all the way back in October 2014. The context of the PMI is such that China remains steadily gripped by the slowdown, and thus a scenario where volatility needs to continue in its global redefinition. The same holds true of the non-manufacturing PMI even though it rebounded to 53.7 from 53.1 in May; just as it has done time and again over the past four years.


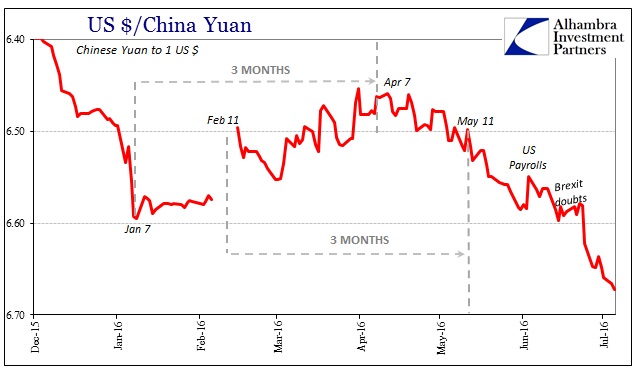
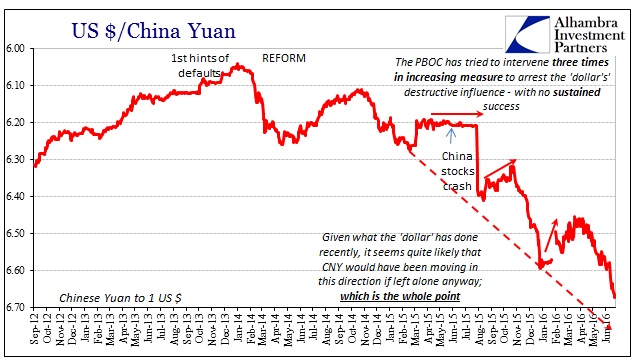
Because China is the central pivot in the eurodollar economy, any account which reflects continued stagnation or contraction is going to be (rightfully) viewed on a global basis. China doesn’t grow because the world doesn’t grow, and that means a much more volatile and uncertain baseline case for funding markets and then everything else thereafter – starting with the Asian “dollar” that shows up via CNY.


Stay In Touch