
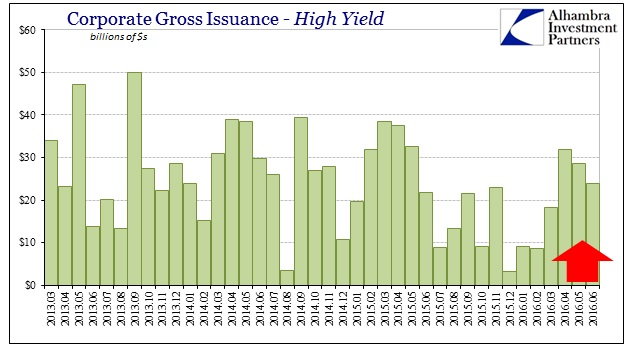
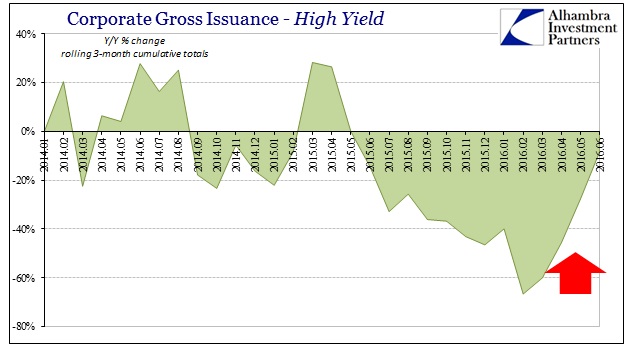
One of the consequences of last year’s junk bond blowup was, unsurprisingly, a dramatic decline in high yield gross issuance. The numbers were pretty stark. According to SIFMA, high yield gross issuance in Q1 was 60% less than Q1 2015, following Q4 which was 47% below Q4 2014. As the market has come back since March, for all sorts of reasons including Mario Draghi, issuance has, as well – but not to the same sort of condition as before. In other words, volume is only relatively better than the worst months.
Gross junk issuance in June 2016 is preliminarily figured to have been $24 billion, higher than the $21.7 billion in June 2015 but significantly less than the nearly $30 billion floated in June 2014. These tough comparisons underscore the nature of not just the depth of market effects but really the prolonged period of irregularity. For Q2 overall, junk bond issuance was still 8% less than the same quarter in 2015. Again, that is better than the near-collapse of Q1, but not anything like full restoration let alone making up for a lost year.
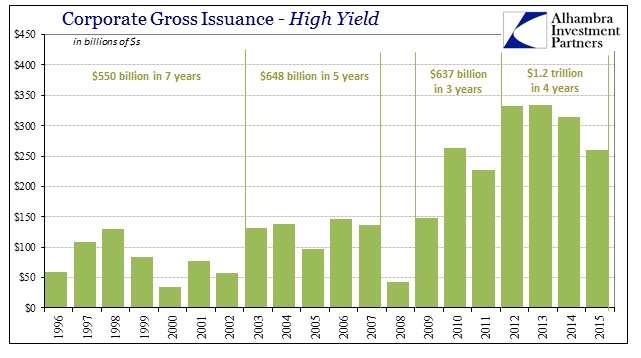
From the annual figures, you can clearly see that junk bonds have struggled since 2013. The “rising dollar” hasn’t been kind to this part of the credit market, an obvious economic problem given that huge burst in issuance starting in 2012 offered at least some marginal (artificial) support to the economy. As issuance slowed in 2014, especially later in that year, it is likely more than coincidence that seemingly steady and slow economic growth gave up to slow and steady contraction especially in manufacturing and industry.
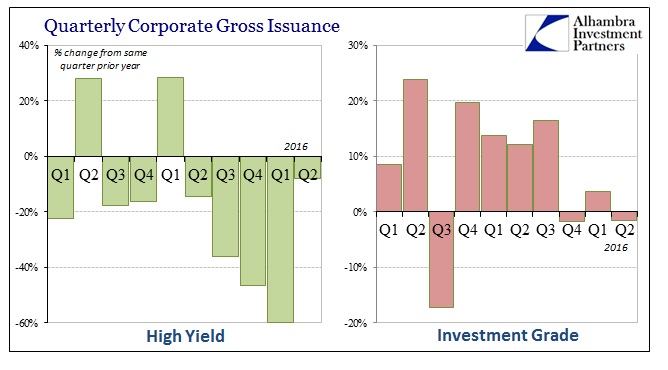
But as much as junk bonds are (rightly) emphasized, it may be that investment grade corporate issuance suggests the next stage of destabilization in credit. Since last summer, IG volume has also dropped off. And though the estimated gross for May 2016 was the highest in years, overall in Q2 total issuance was down slightly compared to Q2 2015 when 10-20% growth in IG volume had become seemingly normal. With three consecutive quarters now of below-trend totals, it seems reasonable to assume that there are deeper corporate credit problems than just the junk bubble.
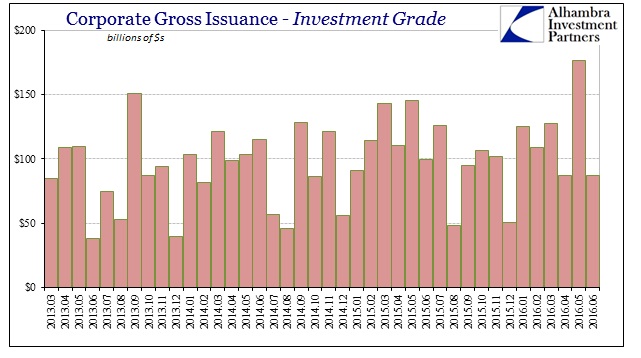
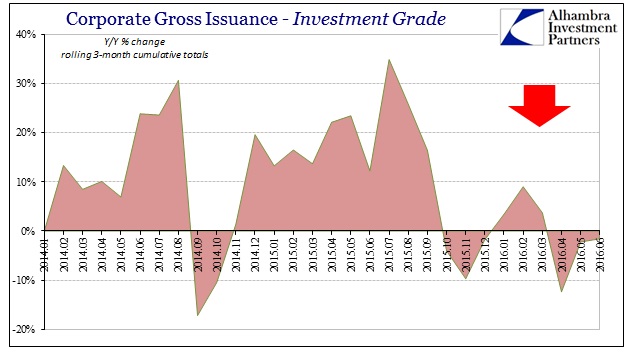
It is more good evidence that “something” changed in the middle of last year, meaning a durable or even permanent deviation from the prior trend. Given the early estimates for June issuance filling out Q2, we can also reasonably infer that despite the seemingly more (outwardly) benign conditions in the past few months after the end of the last liquidation wave/”dollar” run it was not representative of a true inflection or turnaround back toward pre-summer 2015 operation.
We have suspected as much all along, especially since the more fundamental indications of eurodollar liquidity and capacity did not participate in the relief to nearly the same extent as stocks or oil prices. In some places, such as eurodollar futures, the warning of “dollar” condition hasn’t much changed, if at all, from the low of February 11. The issuance figures seem to confirm that view in the vital connection between liquidity or funding to credit to the real economy (or, as may be in the case of IG corporate debt, stock prices through buybacks).
This drawdown also seems to have extended into at least some parts of the banking system, as well. The Wall Street Journal reported on Monday that ABS issuance was off 37%, again including Q2, not just Q1.
America’s shadow banking system slowed sharply through the end of June, with the value of bonds backed by personal, corporate and real-estate loans falling $98 billion from the first half of 2015…
The resulting drop-off in issuance is roughly equal to the volume of loans that Fifth Third Bancorp, one of the country’s largest regional banks, has on its balance sheet, according to data provider SNL Financial. It represents another weight on an economy already notable for weak business investment.
There are several possible explanations, including first the liquidations themselves. Disruptive volatility in isolation may cause only temporary pause, but repeated volatility can turn off financial interest entirely. I also have to believe that the nature of especially the second liquidation was confirming of suspicions that had been forming throughout this “rising dollar” period. In other words, central bank promises had alarmingly fallen short or even unwound in real economic conditions that looked nothing like what was “supposed” to have been delivered by effective monetary policy. That has very real implications not just for the economy, but especially credit markets as a whole and modeled projections for both the credit and default cycles.
The further erosion in financial terms of central bank myths would only add to any reluctance of the market to absorb forever increasing supply, whether junk or IG. The same effect on the liquidity system would also be a related and similar negative factor in what might be a durable alteration to such aggregate risk appetite.
It is astounding both the similarities between especially the “rising dollar” period of the post-2012 slowdown and the monetary/eurodollar irregularities of 2007-08. The primary difference, however, seems to be pace. In the earlier crisis period, events conspired in condensed fashion to create a cascading financial effect that quickly and sharply imperiled the global economy. This time, however, the financial blows are spaced further apart but no less relentless and concerning. It is, almost, a slow-motion crash with plenty of time in between specific events to question why it might not be what it so easily seems. All the same elements are clicking into their unwelcome but familiar places, they are just doing so at a frustratingly leisurely pace.
This lack of follow-through urgency may be in good part misleading, especially since it allows policymakers and the mainstream to continue to treat each episode as unrelated and distinct; almost (regular) randomness. In fact, they are all related if drawn-out warnings about further financial and economic deterioration. There is a direct line between June 2014 repo irregularities and October 15, 2014, January 15, 2015, the events of last August, the events of January/February and now the continuing or even escalating negative pressures.
From the narrow standpoint of corporate credit and gross issuance, these estimates do suggest just that kind of escalation, especially given that Q2 was supposed to have been appreciably better than Q1. Again, liquidity and funding market indications were never possessed with so much exuberance after February 11 and the PBOC’s “dollar” injections, leaving the past few months to be properly classified as only the absence of further disorder and liquidation rather than meaningful retracement or systemic rebound.
Stay In Touch