
The BLS released yet another perfect payroll report for July. It hit on all the major themes, putting further distance to the shocking May number. All the right people have been reassured by all the right parts.
U.S. employment rose at a solid clip in July and wages rebounded after a surprise stall in the prior month, signs of an improving economy that opened the door wider to a Federal Reserve interest rate increase in September…
“We view this report as easily clearing the hurdle needed to keep the Fed on track for a September rate hike. The bar for not moving now is much higher,” said Rob Martin, an economist at Barclays in New York.
Unfortunately for anyone who still thinks the Establishment Survey contains useful information, the quotes above were written in August 2015, not August 2016, about the July 2015, not July 2016, jobs figures. That happy sentiment last year at this time was derived from the initial estimate of +215k, less than the current July’s +255k. After revisions showed that, at least according to the BLS view of the trend-cycle world, the labor market last summer was supposedly much stronger than first thought, the Establishment Survey now registers an impressive +277k for July 2015.
And it mattered not one bit.
Indeed, the last two months in purported job gains average, with June’s “reassuring” figure revised higher to +292k, +274k which is actually slightly less than the +282k average of the last three months of 2015. That purported strength in labor ultimately failed to prevent what immediately followed, not just in terms of markets and asset prices in January and February but in the real economy where every other data point, including GDP fighting through extra applied seasonality, raised very real and widespread fears of perhaps imminent recession.
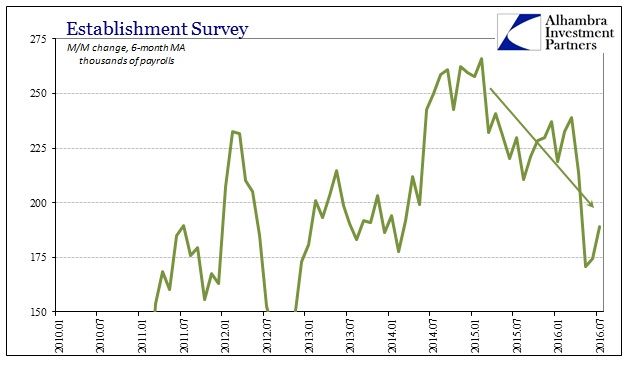
In fact, that is the only part of the payroll reports that makes any sense and only in the direction in which it is heading. Despite the past two months, the trend in the Establishment Survey is still lower and perhaps significantly so. Because of the sudden and huge burst of estimated activity in 2014, commentary is skewed toward that perception as if it were an actual economic upswing. But we don’t find it anywhere other than temporary GDP factors and minor improvements from the weak, Polar Vortex start to 2014 (suggesting, again, that the BLS has been over-amplifying through trend-cycle components minor variations).
When examining inflation, for example, from the view of this “best jobs market in decades” it doesn’t make any sense. How can the labor market be so robust and yet inflation in either the PCE Deflator or the CPI (or anything in between) instead fall? If you take the Establishment Survey as valid, then you will view inflation as a temporary factor of oil prices that can’t be related to your view. If, however, you view the economy from outside the BLS framework, calculated inflation starts to make perfect sense, including oil prices.
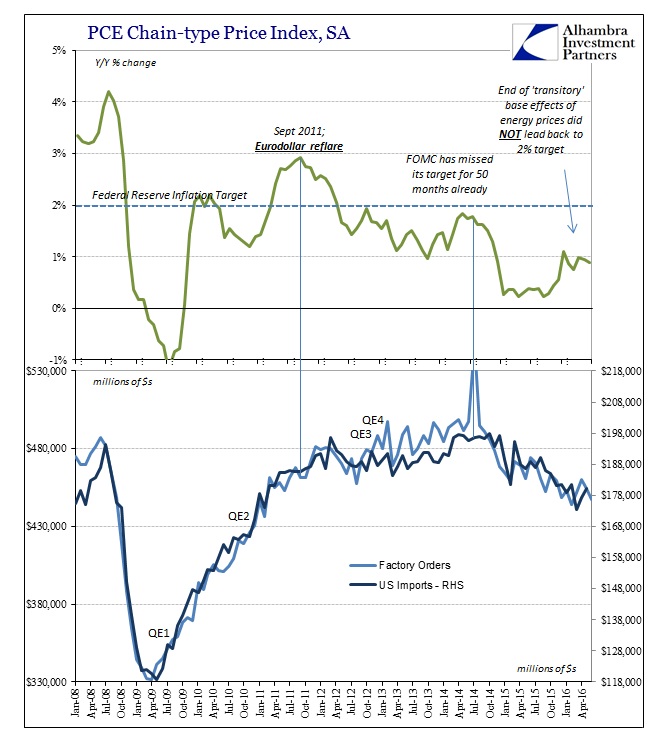
And it doesn’t matter what data points you use in either of those charts and comparisons. Factory orders and US imports are a very good proxy for overall US “demand” and rather than signify anything about a substantial upturn in 2014 they show the opposite. It didn’t matter one bit that job gains in June 2014 according to the Establishment Survey were +306k, or +331k that November followed by +292k in December; oil prices, inflation, factory orders, even GDP (before extra, extra seasonality) all declined sharply in spite of whatever other factors the payroll statistics were derived from.
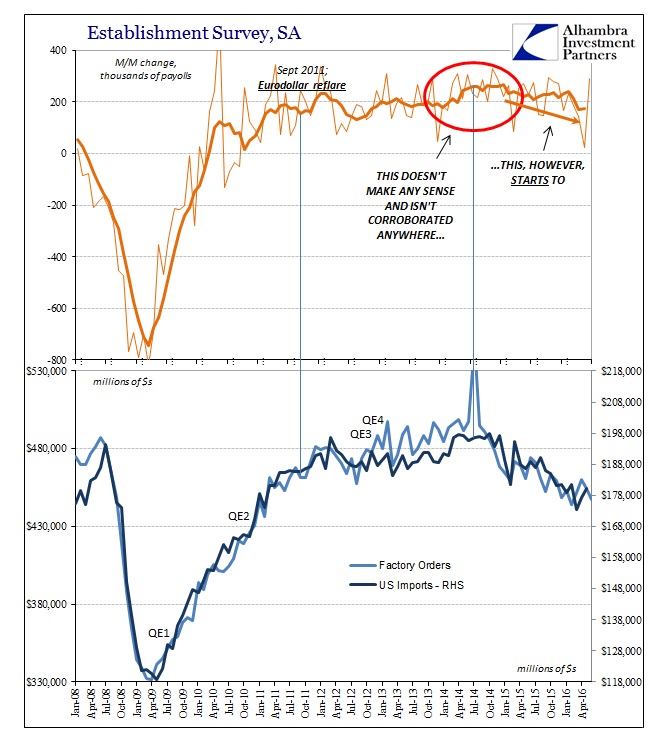
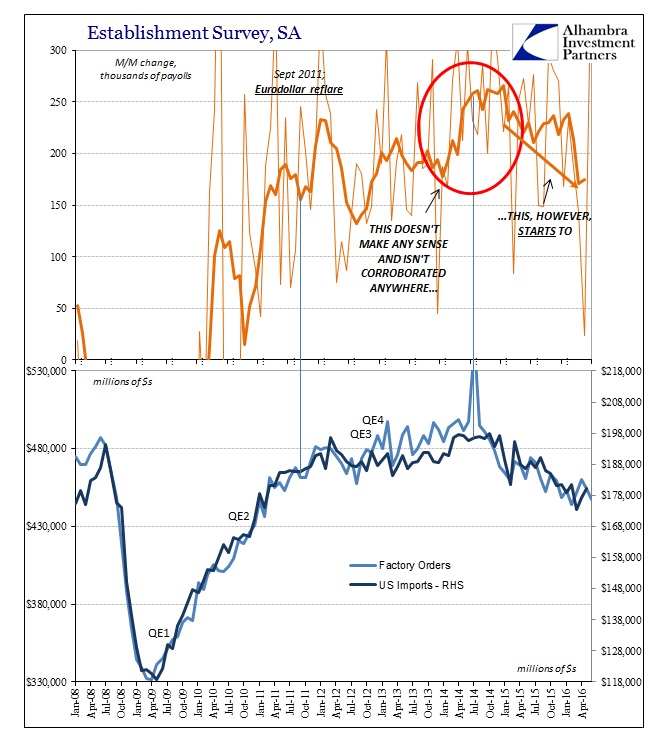
The scale of the discrepancy isn’t immediately apparent above because of the disaster of the Great Recession and its huge contraction that has never been addressed (more on that below). However, there was far more in agreement between US “demand” as represented by factory orders and imports and the Establishment Survey before the middle of 2014. Zoomed in, the difference is as obvious as it has been misleading.
With somewhat of a lag, the payroll reports show in 2012 weakness that like factory orders and imports was the slowdown phase coming out of the 2011 eurodollar problems. The average Establishment Survey gain remained largely under +200k until June 2014. In other words, exactly where the economy not just in the US but almost everywhere else started into this latest downturn, the payroll estimates at the same time did the opposite; and it has been a major impediment to more widespread appreciation for what followed, none of which should have been “unexpected” but is because economists keep saying that the labor market is robust and therefore consumers will have to be (eventually).
Apart from that jump up in the absolute delta, the second derivative since the start of 2015 begins makes much more sense. In other words, the media remains focused on +252k in July 2016 as if that were nontrivial and large when in fact the only significance might be that July 2016’s number is less than July 2015. The trend over the past two years is the only part of the payroll report that actually makes sense and is corroborated by other economic accounts, but economists’ opinions and mainstream commentary are all heavily colored by the bump in 2014 instead of the comparison since then.
Because the gains in the Establishment Survey have not (at all) translated into downstream economic activity we must conclude that either the jobs created were of such low quality and value as to be just that economically meaningless, or that the BLS overstated what happened in 2014 and that amplification factor continues to overstate the absolute change in monthly payrolls even as the labor market decelerates in tandem with “demand.”
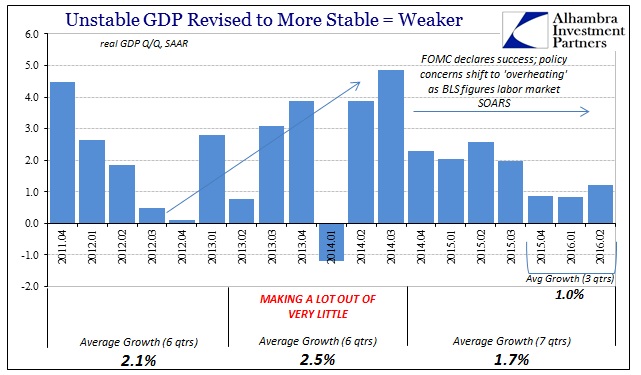
GDP in Q2 and Q3 2014 averaged 4.37% and at the same time the average monthly job gain was +261k. The average payroll increase in the nine months through June 2016 was a solid, even impressive sounding +215k; GDP during those three quarters averaged just 0.97%, very concerning and justifiably so for a stretch lasting almost a full year. The +215k is by itself misleading but that is where the focus remains; it only makes sense when “normalized” by context and really common sense in comparison to that +261k and then viewing the +261k with suspicion.
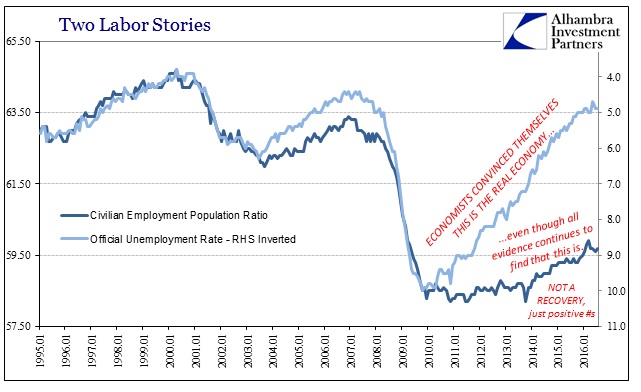
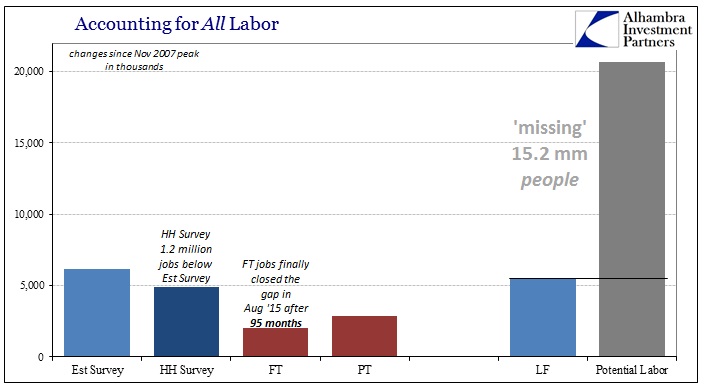
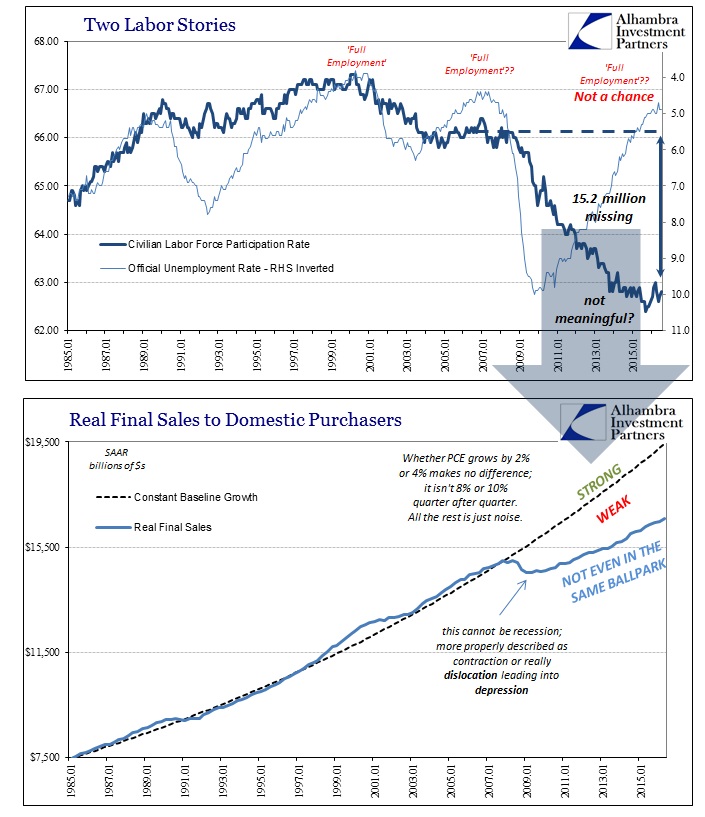
The 2014 job gains also fail in the more important overall economic condition, as it ignores the fact that even at a sustained +300k or +400k pace the gains would still be nowhere near enough to actually produce a recovery. When discussing the labor market, the 15 million or so still “missing” are just ignored as they were all the personal choice of Baby Boomer retirement. While the payroll statistics may omit them from official existence, the real economy, the global economy cannot and has not set them so easily aside.
The BLS’s statistical processes were never designed for these conditions and it shows – when you look.
Stay In Touch