
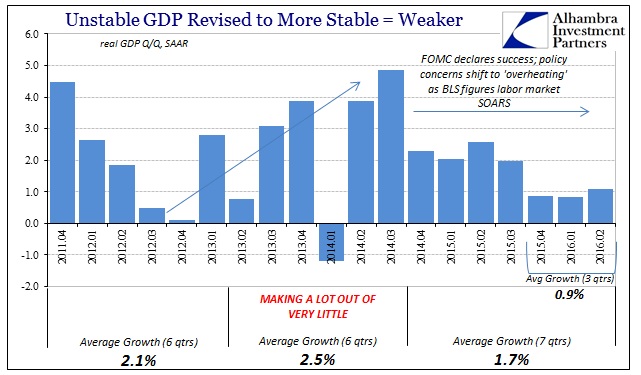
Second quarter 2016 GDP was revised slightly lower, from about 1.21% to just 1.09%. That changes nothing from the preliminary estimate, as real GDP has averaged now only 0.93% over the past three quarters since last summer’s major, global disruption. Since the FOMC declared risks “balanced” and heading toward “overheating” in late 2014, economic growth as measured by GDP has instead decelerated and noticeably so.
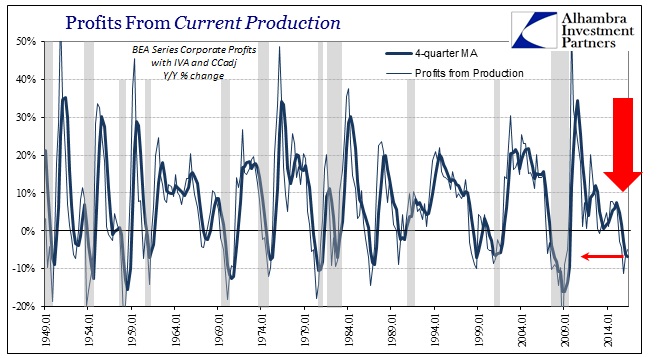
With no major revisions to the headlines, the only interesting part of the GDP report was its first look at corporate profits for Q2. As expected, profits rebounded in general from Q1, which were up from the trough in Q4. Profits from current production, however, slipped again if only slightly and remain close to the trough reached in Q4 2015. This view of the corporate situation is more aligned with the macro conditions of corporate reality.
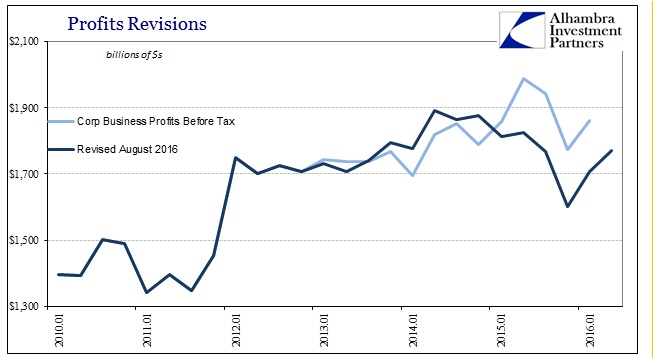
Profits here have fallen now in five straight quarters, a revised succession from the Q1 benchmarks – with the Q4 (so far) trough now showing a contraction of 11.2% year-over-year instead of just -2.8% figured prior. The recalculated series estimates that this sustained contraction in profits began in Q2 2015, turning both Q2 and Q3 last year negative.
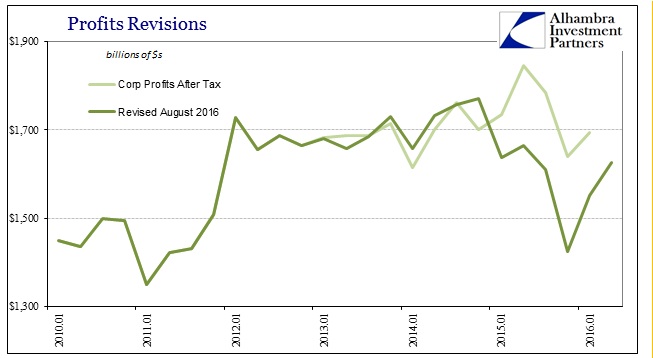
Revisions in the other profit series were far more severe, though it isn’t clear at this point what has forced such large revisions for especially the first half of 2015 (other than reality, that is). In both after tax and before tax profit series, with and without IVA and CCAdj, these recalculations are very different and show a much harsher corporate environment lingering into 2016. That will only be a surprise to economists (decidedly not “transitory”) and once again demonstrates a significant part of the measurement problem – if monetary policy and even just mainstream commentary is “data dependent” then large revisions make that a much more difficult and imprecise process.
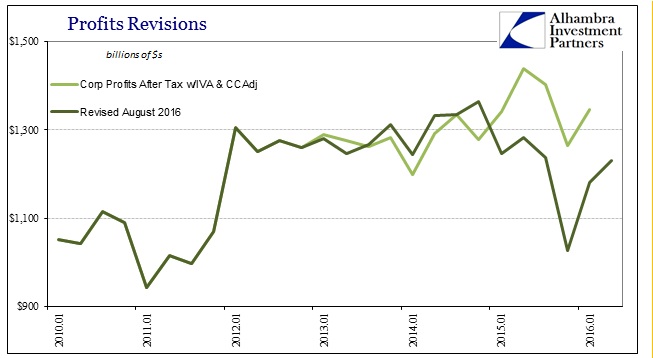
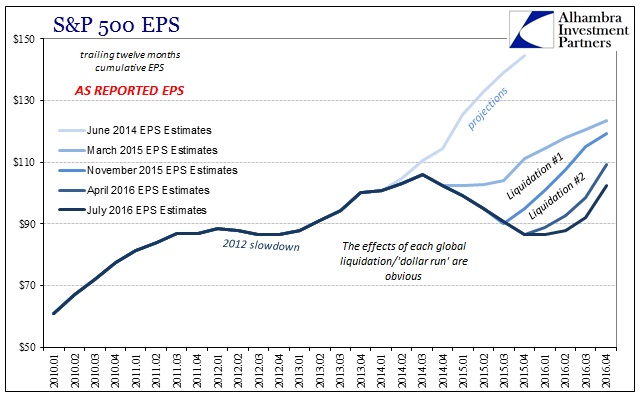
These profit measures now look much more like what we find in non-statistical data such as the calculated earnings for the S&P 500 index companies.
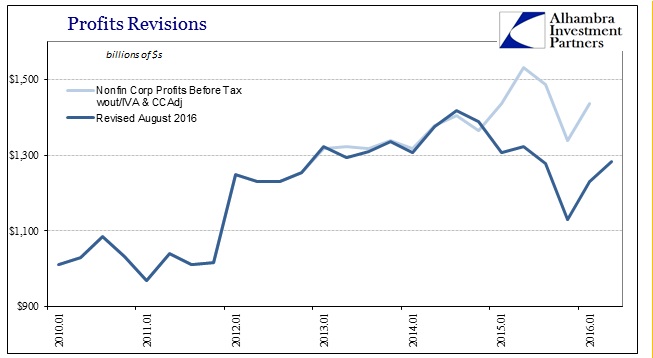
It also suggests the profit “recession” is much deeper and more impactful than just the energy sector alone. The cumulative reduction in the estimated total of before tax profits for nonfinancial business (without IVA & CCadj) was $966 billion in the five quarters from Q1 2015 through Q1 2016! Profits during a very critical economic period, one that explains a lot about what actually happened (rather than continuing to suggest what “should” have happened), are almost 14% less than thought just three months ago.
With profits from current production declining in Q2, it is unsurprising to find that the BEA’s measure of corporate cash flow did, too. Cash flow (SAAR) has been stuck around $2 trillion or so for an astounding 27 quarters dating back to late 2009. This lack of sustained growth for the corporate sector is undoubtedly one of the primary reasons for not just the lack of recovery but almost certainly the labor component of it. Without actual cash flow growth from business operations, setting aside any additions to balance sheet liquidity due to debt (which has mostly been served for financial reinvestment in share repurchasing), it indicates that the US corporate sector truly wouldn’t have had any use for additional labor. And that includes the past few years of the so-called “best jobs market in decades.
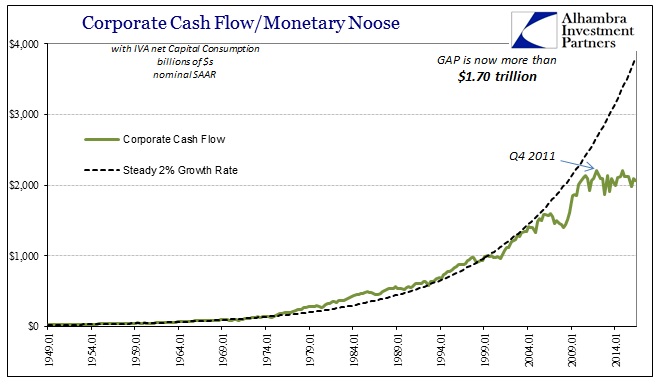
After benchmark revisions, the BEA now estimates that cash flow in Q2 2016 was just $2.07 trillion (SAAR), down from $2.09 trillion in Q1, and not much better than the $1.98 trillion of Q4, which was the worst level since 2012. In fact, cash flow for Q1 is 6.4% less than Q4 2011 and only slightly higher than Q1 2010. That might not add up to recession at any point in between, but it is clear, sustained contraction in comparison to what an actual recovery would look like. The gap to the prior baseline level is now more than $1.7 trillion.
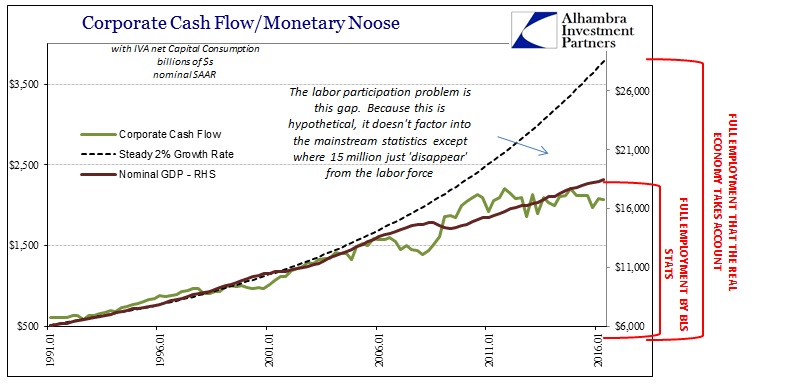
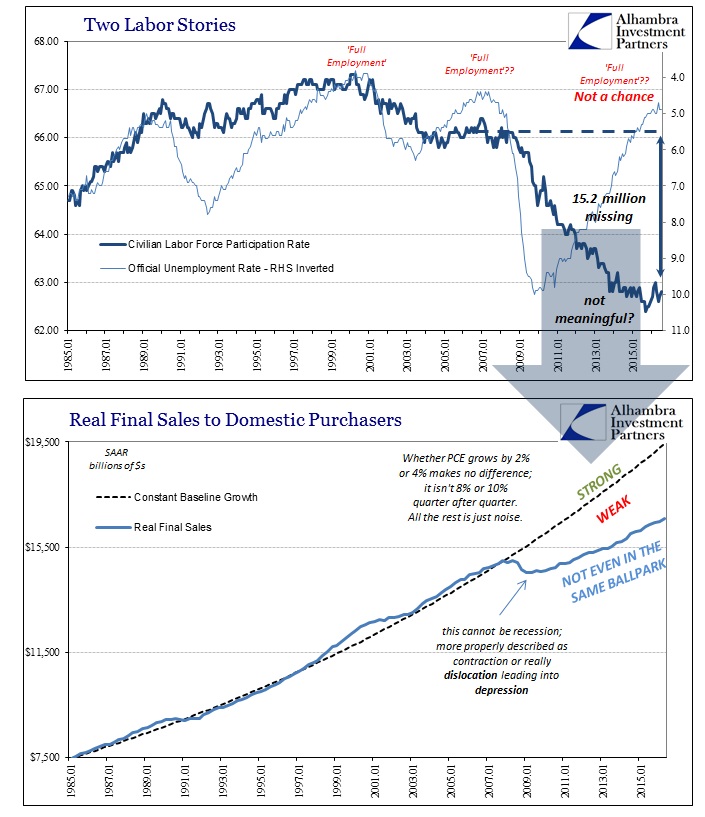
This more-than-temporary reduction in overall basic business growth, to nearly zero despite so many years, is again a very good indication/explanation for the labor force participation problem. It argues for non-cyclicality, meaning that the Great Recession could not have been a recession. The relationship between cash flow, labor, and nominal GDP in this context makes sense, all adding up to serious economic stagnation (at best).
Despite the fact that QE and monetary policy continue to be referred to as “stimulus”, none of the Fed’s efforts are at all visible in any of these arrangements and trends; particularly profits and cash flows. Instead, we find, as usual, continued and consistent evidence arguing that this malaise, and its indications for labor utilization, is still ongoing. With profits failing to rebound all that much in Q2, and falling in two very important views, it might even suggest continued amplified weakness in this “rising dollar” period.
Stay In Touch