
Just a little over a year ago, the Institute for Supply Management (ISM) released its purchasing manager index for the services sector for August 2015. Though the level was down slightly from July, coming amidst the immediate aftermath of the “shocking” financial quakes starting in China and spreading to markets all over the world, the 59.0 non-manufacturing PMI was welcome relief. In the mainstream narrative where the unemployment rate was meaningful, any positive indication about the services economy allowed economists and policymakers to assert that any weakness was either temporary or isolated.
When oil prices first dropped starting in late 2014, the narrative was far more the former (“transitory”). By August last year, when financial markets far beyond WTI were drawn inward into the “unexpected” maelstrom, the narrative changed to admit that weakness might be a problem but only for manufacturing. In writing about the ISM Non-manufacturing PMI for August 2015 the Wall Street Journal assured us:
The U.S. service sector expanded at a slower pace in August but continues to grow at a solid rate, a sign of strength for the domestic economy…
An ISM report on manufacturing, released earlier this week, showed that sector is growing at its slowest pace in more than two years. But manufacturing accounts for only about 12% of U.S. economic output.
Thursday’s report shows “the other 88% is apparently doing very well,” said Paul Ashworth, economist with Capital Economics.
The allusions to “12%” became so common that the myth about manufacturing’s place in the US economy still endures. But even if that were true, one-eighth of the whole should not have been so easily dismissed. If it weren’t for the unemployment rate, the cart would not have been in front of the horse. In other words, subtract any possible meaning from the labor statistics and the manufacturing sector is transformed from isolated inconsequence to stark economic warning.
It all went unheeded because of the idea of “full employment” coupled with the lack of recovery to that point (depression). In past cycles it wasn’t unusual to find “full employment” near the peak in the cycle, but in this case any possibility of a “peak” would be concurrent with no cycle at all. In 2015, as distinct from 2005 or the late 1990’s or all prior recession patterns, economists and policymakers were looking to the unemployment rate at 5% as if it were the start of the “boom” not its end. Because that view had become so entrenched by especially misreading the minor improvement (but still, importantly, uneven) in 2014, the media followed Janet Yellen into utter confusion.
From this view, the huge positive effects of “full employment” were simply pushed off into 2016 once all the minor distractions faded into the background. From the monetary view of the “rising dollar”, such expectations were absurd particularly given the weakness in manufacturing as properly viewed as the point of economic infection. As I wrote last week:
The pace of all this deceleration is nothing like recession, but the general behavior and the order of these processes are familiar in that regard. In other words, what started out as commodity prices and financial negativity moved into manufacturing and then trade (goods and the trade of goods always get hit first in monetary events like the “rising dollar”), all of which was dismissed and ignored as either temporary or contained to just 12% of the economy. From that perspective it was believed this year would be nothing like last year, and so far that is proving to be the case just not in the direction economists and policymakers expected. In other words, a broad view of the labor market shows that what might have been limited (but forewarning) weakness in 2015 is spreading not abating such that even the labor market is showing signs of being broadly affected.
Where the ISM Non-manufacturing PMI was 59 and 60 last summer, it slowed to 53.5 (revised) by January. Then, as usual in spring, it rebounded to a peak of 56.7 by June, only now to crash into summer:
The U.S. economy’s service sector expanded in August but at a slower pace than in July, and the fall from the previous month was the largest since the 2008 financial crisis, according to an industry report released on Tuesday.
In fact, at just 51.4 that was the lowest reading since early 2010. The mainstream perspective of all this economic data is just false in so many different ways – starting with interpreting these PMI’s. The ISM itself wrote last September with regard to August 2015’s 59.0 that, “Overall, respondents continue to be optimistic about business conditions and the economy. This is reflected by indexes that are again strong; however, lower than what was seen in July.” That was not, in fact, the determination of the index; rather it was the interpretation of “full employment” applied to the index.
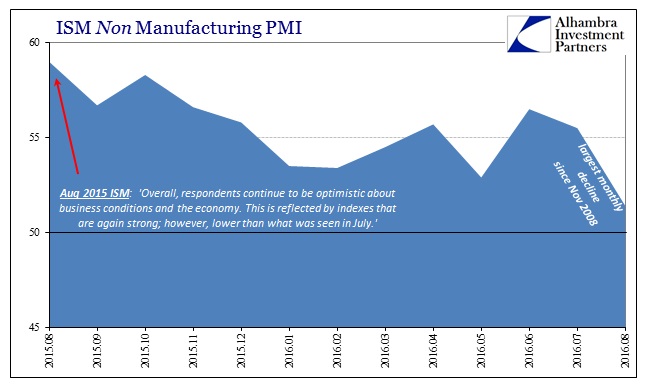
What actually happened was instead that the non-manufacturing PMI had already begun a yearlong (so far) descent to now 51.4 and signaling widespread weakness throughout the economy but particularly consumer spending. Again, the manufacturing weakness that preceded all this was not an aberration but rather an example of what was coming.
It was the labor statistics, especially the unemployment rate but also the mainstream view of the Establishment Survey, which should have been viewed as anomalous. That would have allowed the proper analytical framework for everything from seasonality to the “rising dollar” as further amplification of monetary distress and decay. This is the central point about the current appearance of Milton Friedman’s interest rate fallacy. As LIBOR rises with repo rates (and fails) and dying volume, everyone wonders where all that possible “tightness” has manifested because by and large we are conditioned to look for it in stock prices or at least some financial market.
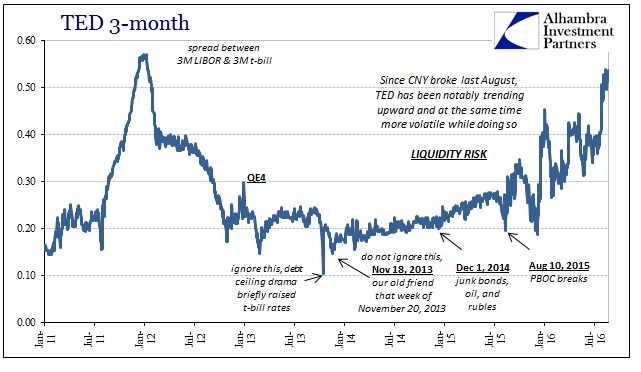
What Friedman actually meant, and what we can observe now, is that low interest rates indicate tight monetary conditions for the real economy. On that score there is no mystery about “tightness” so much that even labor statistics and the seemingly impenetrable services economy are now openly displaying it. You look at the TED spread and see that “something” changed in August last year; you look at the ISM Non-manufacturing PMI and sure enough, same thing. Where eurodollar decay had before cut a great deal off global economic growth (the depression), the “rising dollar” variant of it seems to be that much worse in that it is pushing the real economy into active deceleration and contraction (some places already alarmingly deep).
Stay In Touch