
Chinese oil imports surged again in August to the equivalent of 7.77 million barrels per day (mbpd). That was significantly more than July’s pace of 7.35 mbpd, and up an astounding 1.5 mbpd from August 2015. It was the highest rate of oil imports since April.
The demand for commodities hasn’t been limited to just crude oil, as coal imports also rose to 26.6 million tons, the highest since October 2014. These are not trends that indicate a complete turnaround to a robust Chinese economy, rather one that has become itself poorer. In terms of oil imports, the sharp increase has as much to do with “dollars” as other factors including further production cuts among Chinese domestic sources.
In the first half of the year, internal oil production declined by 5.1% as compared to the first half of 2015. Coal production is off significantly, too. Through July, domestic mining of coal has fallen by more than 10% year-to-date. Low costs of commodities as well as government regulation (pollution) have priced out Chinese energy sources leading to an increase in demand for resources on global markets.
Overall, Chinese imports (in dollars) increased in August for the first time since October 2014. The appearance of a plus sign has led to the usual proclamations that the “bottom is in” and the Chinese economy is at least stabilized if not already on its way to recovery. Even though that word has been so demoted and reduced over the past decade, it still makes its appearance whenever a plus sign does.
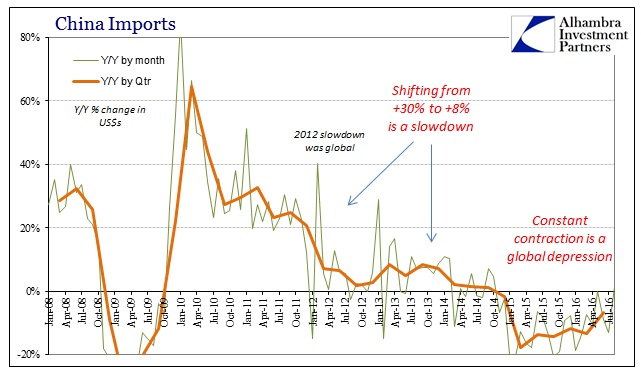
In terms of Chinese imports, this is already quite familiar. Imports for the month of May 2016 were only barely negative, which at the time was deemed close enough to positive to suggest all the same recovery ideas as now. Those, of course, didn’t even last into the next month, as Chinese imports fell again in June (-9%) and then sharply in July (-13%). As usual, monthly variation is extrapolated into often absurd proportions because of the binary model by which all commentary is filtered.
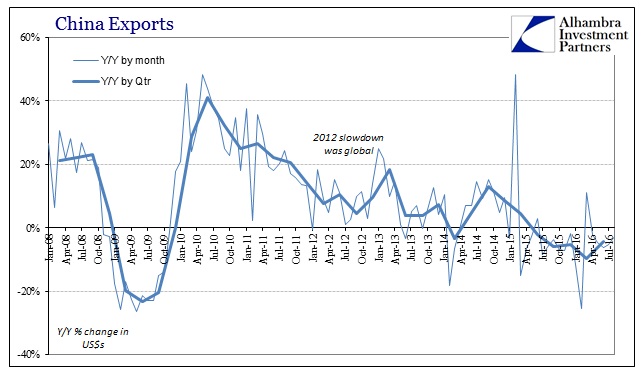
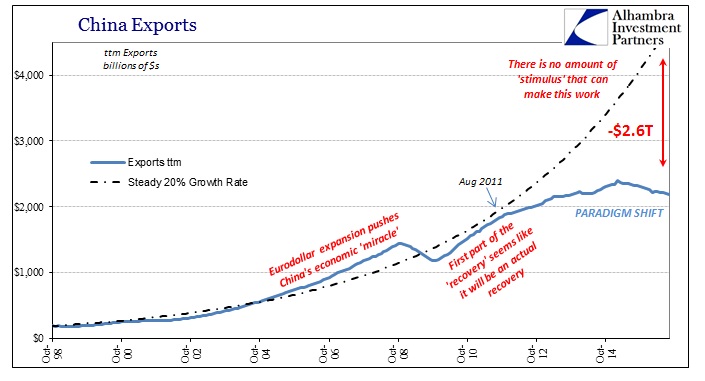
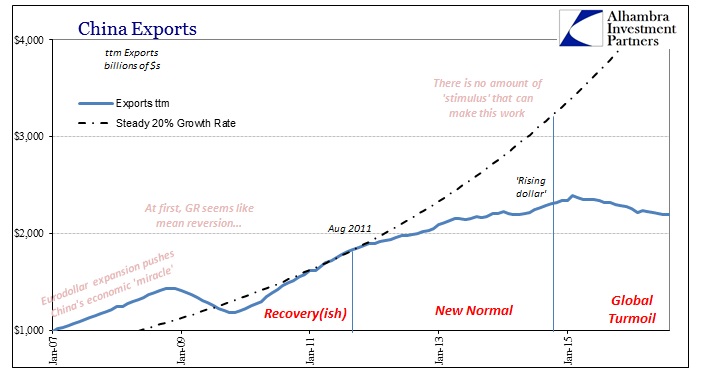
On the export side, Chinese exports (in dollars) fell 2.4% in August year-over-year. In the past twenty months dating back to January 2015, exports have increased in only three; none of them led to any change in the Chinese economic condition that depends upon external trade to drive overall marginal economic considerations (especially fixed asset investment).
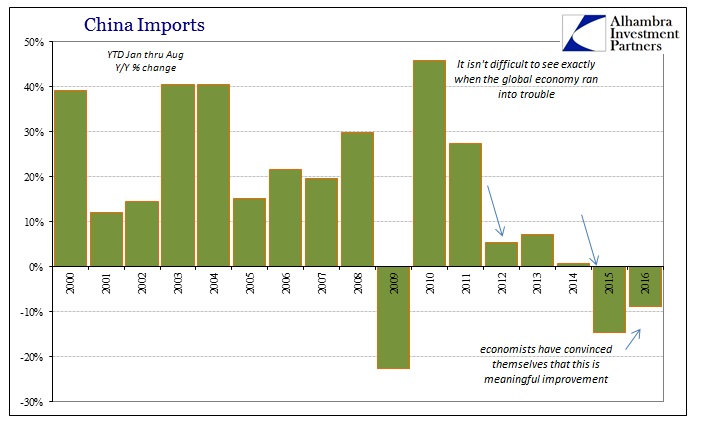
Year-to-date, Chinese imports are down almost 9% from the first eight months of 2015. That is slightly better than YTD through August 2015 as compared to the same period in 2014, when imports contracted by 14.5%. It is a long, long way to get back to 27.5% growth in the first eight months of 2011 over 2010, which was more consistent with the pre-crisis period where eurodollar growth drove world trade expansion. The appearance of a positive number doesn’t necessarily mean that the long road to recovery has begun, as so many former false starts can attest to.
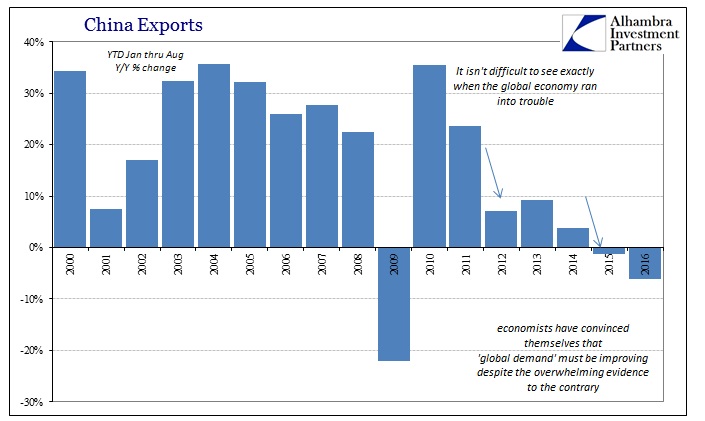
After all, conditions on the other side of China’s trade ledger are, in contrast to imports, relatively worse in 2016 than even 2015. So far year-to-date despite what some are taking as a favorable export estimate for August, exports are down 6.2% versus 2015.
For the near term, it seems likely that commodity producers welcome the increase in Chinese imports especially as they might relate to all kinds of resources, but the fact that a good part of it is due to lower internal Chinese production coupled with persistently “sluggish” global demand for Chinese goods does not bode well for the Chinese economy beyond the short run. Uneven as always, the depression marches on in its slow, confusing strangulation.
Stay In Touch