
In many ways it is surprising the bond selloff hasn’t been bigger. After all, the recovery narrative of the unemployment rate has had almost everything going for it since February, at least in terms of perceptions playing into expectations. There was the usual spring rebound in economic data that aided in the “worst is past” argument, while oil prices and commodities rose furthering the market indications that “transitory” might have just been one year delayed. And after a brief scare coincident to the May payroll report (released at the start of June) and then Brexit later that month, it did appear on the surface that markets were indeed quite resilient and could thus handle the mainstream-anticipated liftoff.
In the US treasury market, a recovery would see a steepening yield curve and higher nominal rates, both of which have occurred in September so far but by a rather meager margin especially in comparison to past episodes of such “hope.” These trends would be accompanied by much stronger inflation expectations, especially given how beaten down they have been since this “rising dollar” began. But it is here that the narrative falls apart once more.
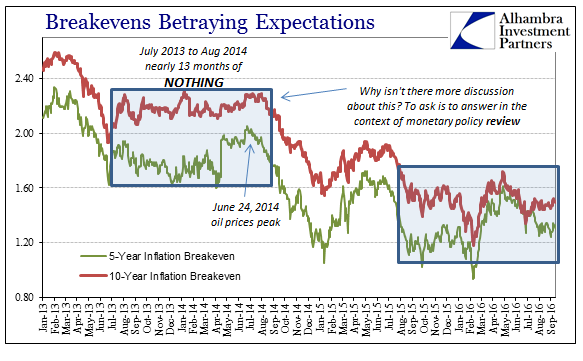
At the end of August I wrote about the curious and frustratingly unexplored period in TIPS trading bridging the so-called taper tantrum and the start of the “rising dollar” about a year after. For about thirteen months, an incredible length of time for any kind of market, breakevens did nothing, and that was an exceptionally important clue as to what was building.
In the realm of moving inflation expectations, there was a period between July 2013 and August 2014 where the 10-year TIPS breakeven “yield” did nothing. The 5-year breakevens followed in somewhat similar fashion, though with a small measure of greater vitality if still almost totally sideways. How this thirteen month period in inflation measuring has escaped constant mainstream reference is yet another crime of negligence. Not only did the market for inflation expectations suddenly appear to be dead or at least stumped, this all occurred at perhaps the most pivotal point of this entire “recovery” period.
Even more than now, the recovery/economic narrative had everything going for it. Every day there was an economist on TV or a policymaker in the news talking confidently about how “this is it.” Not only that, even after the weak, Polar Vortex start to the year, GDP seemed to confirm it, followed by a noticeable boost in employment statistics that turned prior confidence into unrestrained mainstream giddiness.
By the time the Establishment Survey began to suggest the “best jobs market in decades”, however, breakevens had already started downward again. If those thirteen months were indecision, just the uncertain start to the “rising dollar” was enough to break the tie convincingly and the rest has been (unfortunate) history. In other words, inflation expectations trading had been right to not jump on the recovery idea, as much as it was so alluring to do so – especially in light of monetary policy seemingly getting that much closer to the “exit” month by month during that time.
What is interesting and I think relevant today is that apart from the violence in and immediately after the January/February liquidations, inflation breakevens have been remarkably if not similarly in stasis. The 5-year breakeven is somewhat higher than the middle of last year, but more importantly in the 10-year breakeven (long-term considerations where the inflation “anchor” is supposed to lie) the level today is practically unchanged from August 24, 2015; it was 149 bps then and is 149 bps today despite the treasury selloff of the past few weeks.
It suggests once more that like late 2013/early 2014 inflation expectations are far from “convinced” that anything is truly different. Though Janet Yellen may dismiss the sudden and “unexpected” appearances of darkness in both economy and markets, she has done so quite consistently (as Bernanke before her) and has been absolutely and often embarrassingly wrong to do so. And like then, there are indications that beneath the surface of all this renewed optimism still lurks the same nagging dangers.
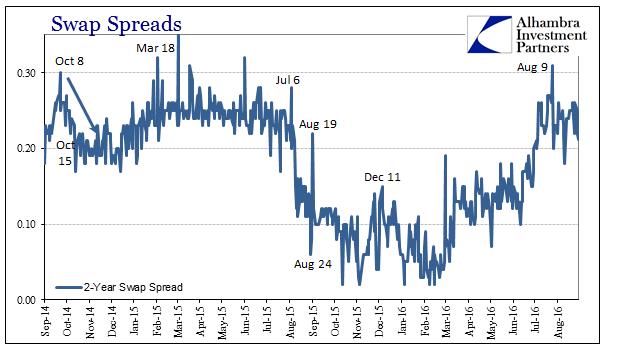
I could catalog all those negative contradictions, including, as noted earlier today, those related to Chinese “dollars”, but I think it easier and representative enough to focus on just a couple. The first is swap spreads. There is perhaps no more forthright indication of aggregate eurodollar balance sheet capacity than when spreads are negative and perhaps become more so.
The 30-year, in particular, provided ample warning about what was to come last year. While the spring rebound was in effect with oil prices rising and even breakevens then, too, swap spreads began to suggest a much more intractable “dollar” problem in the shadows.
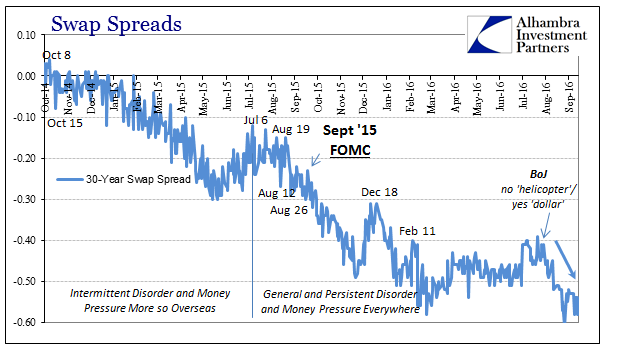
That warning would continue even after August, with spreads becoming increasingly negative all the way into January 2016 – and pulling down the rest of the swap curve with it. A negative spread is itself meaningless, except for what it tells us about offered balance sheet capacity.
A negative swap spread…assaults conventional financial sense. To most, a negative spread is nonsense and leads to so much consternation about how to interpret the situation when it has arisen. Unfortunately in 2015, especially after July 6, it has been near-universal across far too many maturities. While on the surface it would suggest that the “market” in swap derivatives is pricing more risk of UST’s than swap counterparties, the only real inference about such compression is the nonsense itself. In other words, the nonsense nature of negative swap spreads is precisely the point – for them to be negative in the first place, let alone highly so (like the 30s again), is a pretty unambiguous signal of malfunction if not full distress. It is only great imbalance that can change the information content of a market price into meaninglessness; therefore we can interpret that case as some great reduction in balance sheet capacity since it is dealer capacity that determines the nature of the spreads.
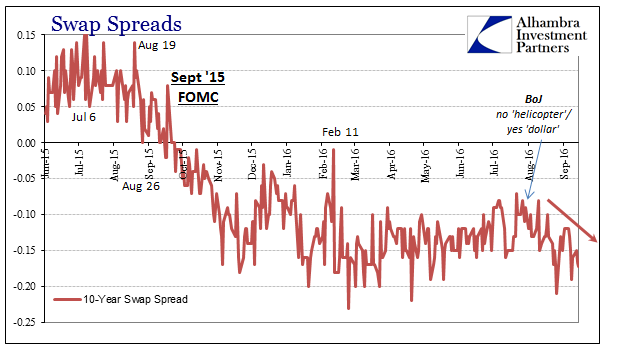
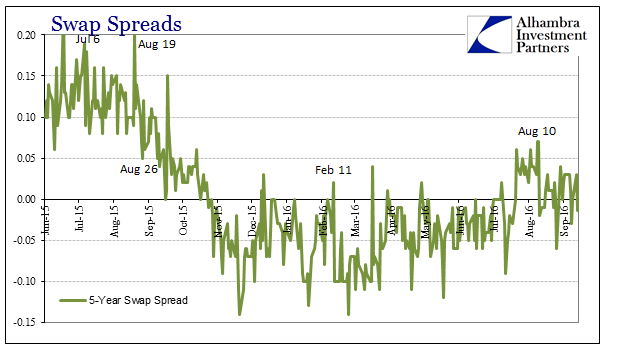
Ever since late July 2016, swap spreads have shifted again. Those longer dated such as the 10s and really the 30s have dropped again. At the short end, where spreads had been decompressing, that seemingly favorable trend was halted.
Such a direct (as much as one may be possible in the eurodollar system) indication of more “dollar” problems should rightly worry inflation trading that otherwise seemingly has every reason to push back toward the recovery idea and levels. If market-based inflation expectations remain subdued it is quite likely because there is good monetary reason to stay so.
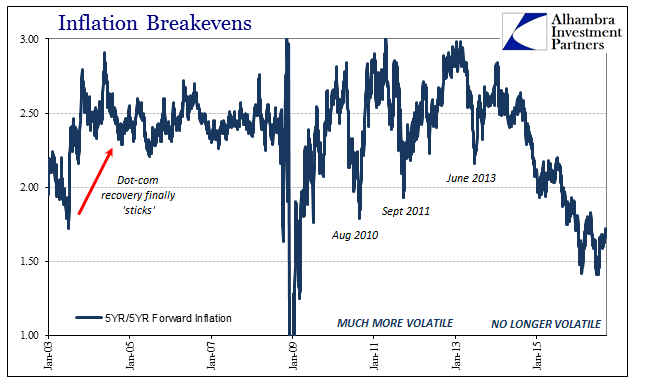
The 5-year/5-year inflation forward rate, which is another measure of longer-term expectations, hit a new and further depressing multi-year low on July 11 just as the Bank of Japan unleashed its “helicopter” rumors to, I believe, try to rescue JPY then in the clutches of the “dollar.” From 143 bps then, the 5-year rate has only rebounded 25 bps to today, so far remaining significantly below the last rebound to late April and, more importantly, incomparable to last year’s temporary enthusiasm.
And I think there is a further Japanese connection as the change in swap spreads is coincident to the BoJ’s actual decision to eschew the “helicopter” to focus instead on the “dollar.” Counterintuitively, the bond selloff that accompanied the change in international conditions has raised expectations of volatility (and acceleration of volatility) across fixed income, thereby reducing balance sheet factors that might otherwise have maintained a stable or improving swap environment (or Chinese connection to the eurodollar in all its dimensions).
In other words, as the Bank of Japan attempted to fix its end of the “dollar” it may have instead further wrecked it, at least for now for everyone else including and especially the Chinese. And that may be the most threatening aspect and why in general terms inflation trading and expectations seem unable to break loose to more hopeful territory (or why even the bond selloff is itself comparatively meek). The eurodollar mess is like quicksand where the more you struggle to get out the more it will suck you further into it. It is, as I proposed at the start of last September, even more evidence of the “nightmare scenario.”
[The PBOC] has, by now, appreciated just how limited actual mobilization of all those “reserves” actually can be, as even doing heavy intervention so far was largely ineffective despite all the convention about having all those protective reserves in the first place – the yuan still broke and China fell into the crosshairs of open disorder. And that is the larger point and confluence, where the PBOC “reserves” may contain further disruption if they aren’t properly calibrated (and they never are; again Brazil, Indonesia and the rest) just as the rest of the world wakes up to the fact that all those reserve piles were instead of being insurance against the worst case are the very problem itself – wholesale exposure as the decay in wholesale eurodollar reaches almost predetermined amplification…
As I mentioned yesterday, “I don’t think it ends until a fundamental change is made; either the economy starts living up to the promises or liquidity subtracts until prices actually reflect that it won’t.”
If you look at inflation breakevens or the 5-year/5-year forward rate that is exactly what you see in ratcheting behavior. Even when things go right (loosely speaking) they go wrong. The fundamental truth is that there is no escape so long as the “dollar” system remains in a critical state. Inflation trading seems to know it, or at least seriously consider it even when the mainstream is already counting the recovery (all over again).
Stay In Touch