
Industrial production in the United States fell by 1.1% year-over-year in August, a slightly larger decline than the -0.6% estimated for each of the two months prior. August’s negative was the twelfth consecutive, marking a full year in slow but unusually persistent contraction at such a slope. The seasonally-adjusted peak was reached in November 2014, meaning that for almost two full years IP, an important and longstanding economic statistic, has indicated only increasing economic ill-health just as the “rising dollar” predicted.
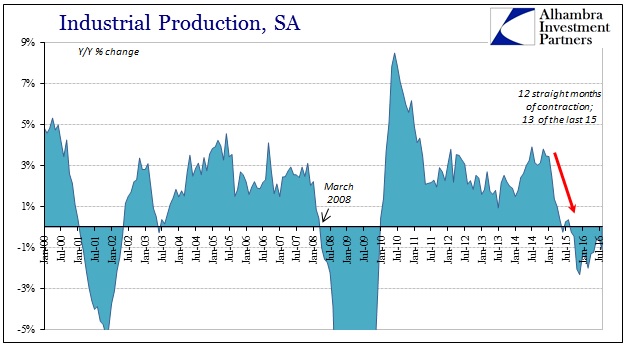
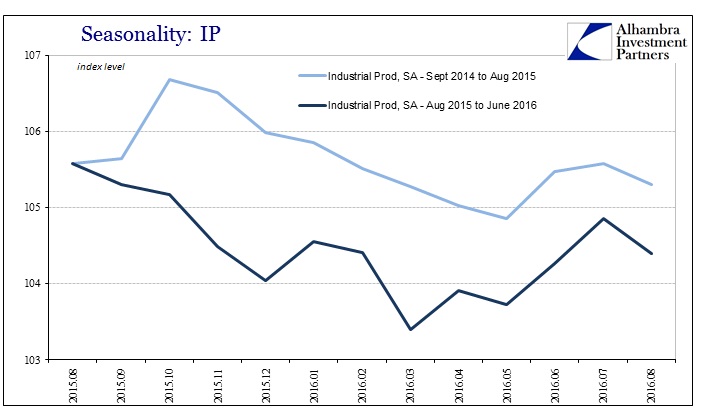
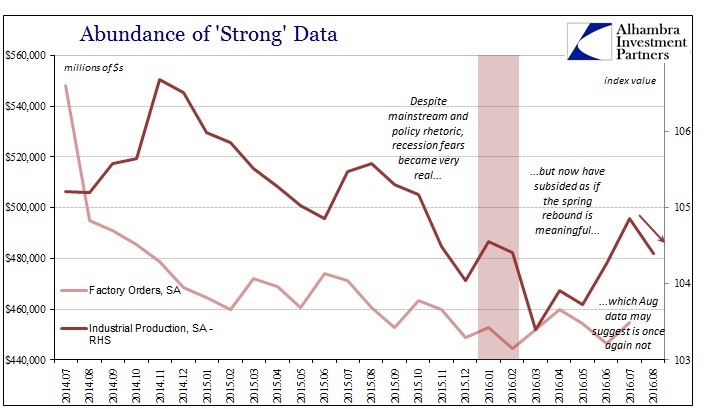
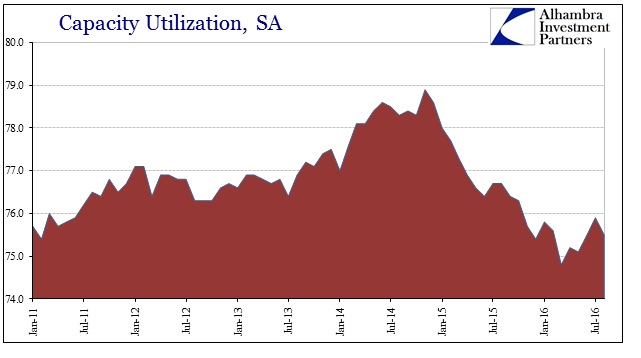
Despite what looked to some like a rebound in production during the spring, the month-over-month decline in August may suggest the now-usual summertime shift (one month certainly does not make a meaningful trend, but so many other manufacturing and industrial accounts have suffered in the past few months). Capacity utilization also fell back in August.
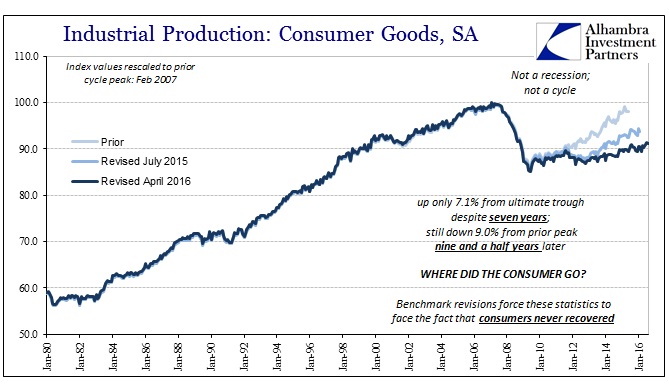
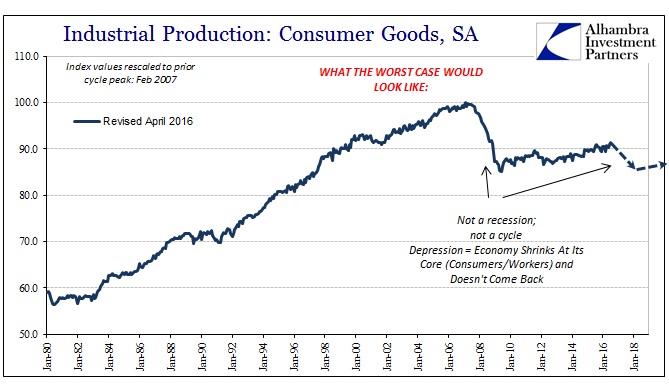
Industrial production relating to consumer goods remains mired in alarming stagnation after having shrunk severely, suggesting that all the action both what little growth there was before the “rising dollar” and now contraction within it has been due to business investment and productive capacity. IP of consumer goods is only 7% total more than the trough of June 2009, more than seven years ago. That level is still, despite just less than a decade, 9% below February 2007.
As we know well from at least Chinese economic figures, US consumers have not been buying goods from overseas producers, certainly not in anywhere near sufficient quantities that would explain this depression. Instead, it only further confirms the absence of cyclicality as well as just how inappropriate the unemployment rate has become in terms of a meaningful economic indicator.
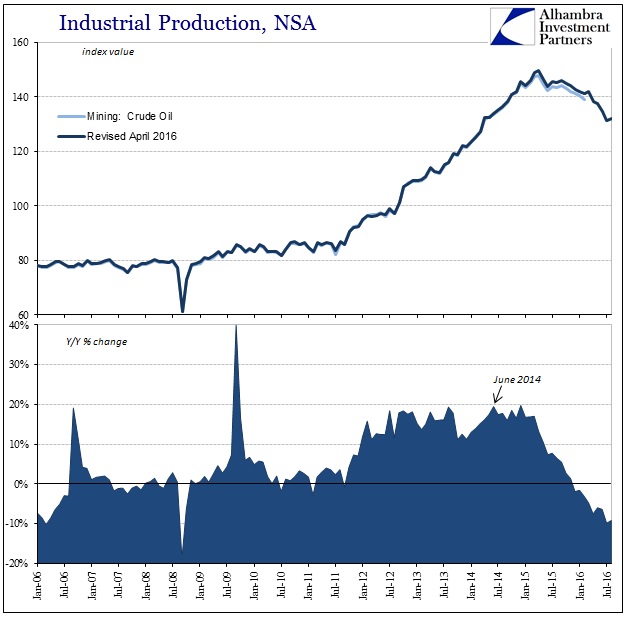
What parts of the industrial sector that may have experienced cyclical forces are seeing them wear off, if not fall off. First, in the mining sector where oil exploration and production had produced a tangible boost to otherwise non-existent growth for American industry has finally seen its clear reversal. The drag throughout 2015 was small, and didn’t really start until mid-year last year – likely at least in some part at the behest of Janet Yellen’s now-disproven “transitory” theme.
Industrial production in crude oil (mining) though up month-over-month from July was still down more than 9% Y/Y for the second month in a row in August. The 6-month average is now -7.3%, meaning that production cuts are both serious and sustained.
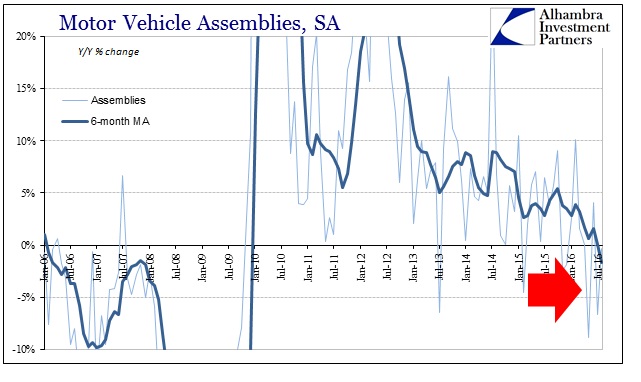
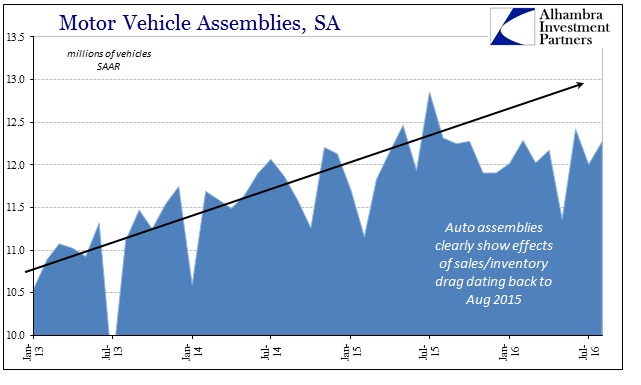
The other sector attributed cyclical pressures is auto production. Motor vehicle assemblies peaked, unsurprisingly, in July last year just prior to the full-blown appearance of “global turmoil.” After registering 12.8 million units (SAAR), assemblies have been less than 12.5 million in each of the thirteen months since. Like the purported “plateau” in auto sales, motor vehicle production seems to be reflecting (if not anticipating, through inventory) that condition and validating it as increasingly real and, more importantly, durable.
Year-over-year, the rate of assemblies contracted for the second consecutive month in August and the third time in the past four. The 6-month average is now negative for the first time since the end of 2009, decelerating sharply.
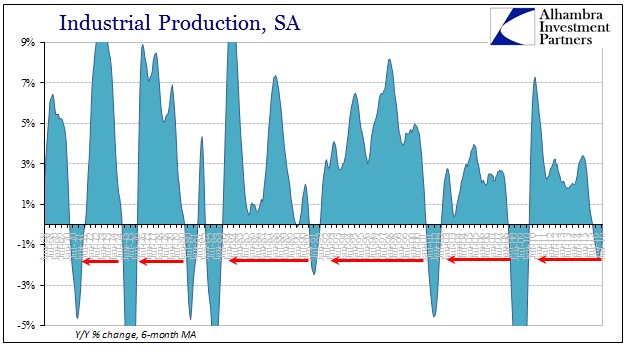
It is the same slow strangulation effects that we find elsewhere in the economic accounts. In the dot-com recession, industrial production peaked June 2000 and declined for a total of seventeen months thereafter. The Great Recession took just nineteen months in IP, starting with December 2007 (coincident to both the official beginning and end). The current decline now stretching 21 months doesn’t compare in terms of its depth, but is more worrisome because it doesn’t. In other words, it clearly isn’t the usual cycle where activity falls sharply and then rebounds (almost) proportionally.
During this “rising dollar”, seasonality aside, production levels fall and then remain lower – only to fall again and suggest still more to come. There is no other way to describe it except slow, steady strangulation undoubtedly related to global money (the “rising dollar” in the first place). The industrial economy, as the whole, seems to be perched on the edge of recession month after month and instead only deteriorates just that much more incrementally; enough to make it a serious problem but not so much that the mainstream is forced out of its binary recession/not recession model. Janet Yellen’s narrative remains alive though in any meaningful sense, as shown by IP of consumer goods, it was truly falsified long before she took office let alone an unemployment rate even close to orthodox notions of “full employment.”
In short, two years of this should be sufficient evidence to show that this economy is like nothing before. “Regular” rules of interpretation just don’t apply. While that might mean no recession now, even though twelve months of overall IP contraction has always meant so in the past, it doesn’t preclude something like one in the near future; an marked acceleration in the so far shallow downward slope. The economic arrow still points down after two years (two plus years of curious deceleration before that) suggesting that we really don’t know what to expect from here on – other than the idea that it will take drastic (in money, not monetary policy) action, not more worthless assurances from policymakers, to actually attain growth again.
Stay In Touch