
Last year, the usual rebound in GDP was flipped. Q1’s are, or were before “residual seasonality”, the low mark followed by some surge at some point. In 2015, it was Q2 that originally jumped, hitting almost 4% in the original estimates. What followed in Q3 was frustration, as GDP was first figured to be only 1.5%. It was disappointing but only to those who thought there was any real difference between 1.5% and 4%. In reality, there wasn’t because the two quarters together were a continuation of the same insufficiency as far as the economy is concerned.
The statistic of GDP is itself misleading, especially since it is overly common to focus on just one quarter at a time, and then just the headline. As I wrote almost exactly a year ago:
That starts with, in my analysis, the great likelihood that the lumpy surge of the past two years (Q2 this year; Q2 & Q3 last year) are going to find the same disappearance as the unevenness originally presented about 2012 and 2013. The instability more than suggests now as it did then, only the BEA refused to acknowledge that until forced by “unexpected” benchmark revelations. That is the pertinent element of GDP as far as predicting, as much as it might, the future course of the US economy.
In truth, we don’t need to go that far in order to understand the current and immediate predicament. With all its imperfections, GDP delivers the unwelcome news in its past performance for anyone wishing to see it. The fact that so many dwell only in the current number has allowed this deficiency to protect and bolster the monetarist case that has so stunningly bombed.
That is to a large extent what happened for 2015, as the current benchmarks removed the lumpiness and left little doubt as to overall, persistent weakness. The “good” quarters always turn out to be the anomalies no matter how many times economists claimed (some still do) it was the “bad” ones that were/are. Some of that is due to how GDP is constructed in its very narrow view; the current estimate being another good example.
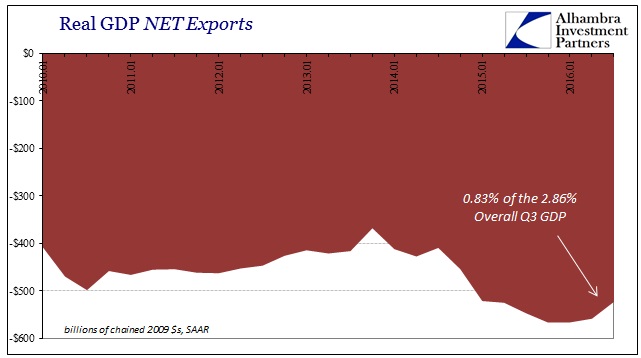
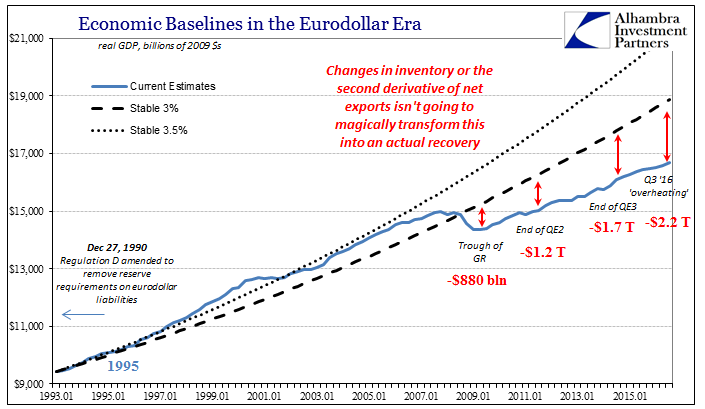
What “lifted” GDP in Q3 was nothing of what we would want to see accelerate. Instead, it was left to the highly variable sectors, particularly inventory and exports. But even those two major contributors were far less convincing than what came out in the overall quarterly figure.
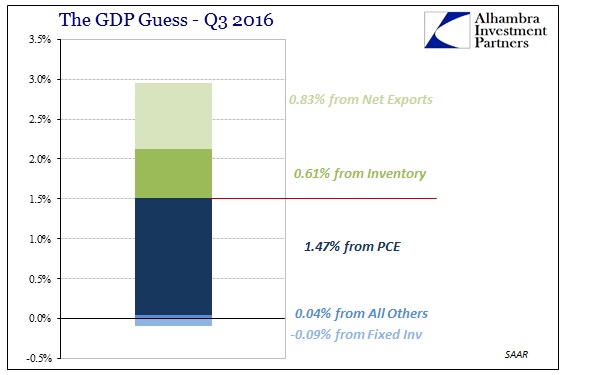
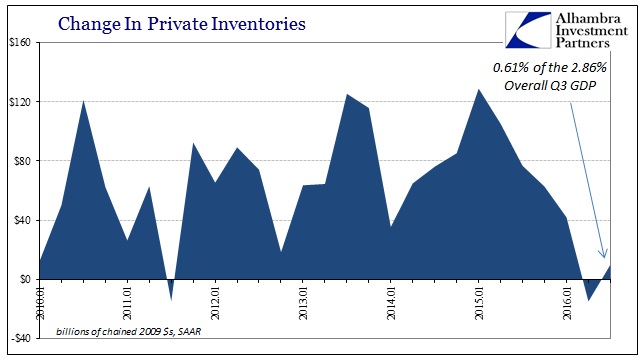
Of the purported 2.86% growth (remember: Q/Q),0.83% was due to Net Exports, while 0.61% was the positive contribution of Net Private Inventories growing again. Without those two, GDP was just 1.42% and continuing the same low trend of the past year.
The change in Net Private Inventories was exceedingly small, however, where in Q2 they shrank by $15 billion in Q3 they expanded by not quite $10 billion. For GDP, what counts is the second derivative or the distance between the rates of change from each quarter. In the tabulation for the statistic it was significant that inventories didn’t shrink again whereas for the actual economy this is splitting hairs after years where “growth” had depended on significant inventory accumulation.
As far as exports, the difference this quarter as compared to the prior quarters of the “rising dollar” is perhaps a bit less ridiculous as inventories, but only in the sense of the raw numbers. Exports did increase by a noticeable if still relatively small amount, of which the vast majority of that number was, as ZeroHedge points out, soy beans alone. It isn’t quite the economic revival that it might at first appear.
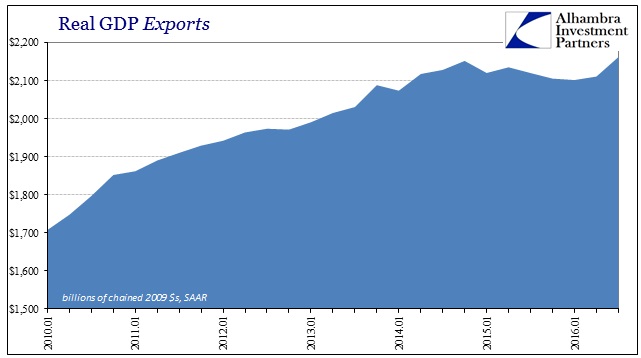
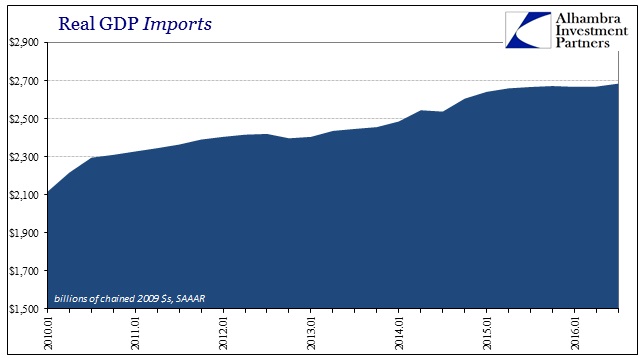
The reason is largely that US imports continue to be stuck, meaning US demand for goods (and services) from the rest of the world has not changed one bit in almost two years’ time. But because we sent more soy beans abroad due to, apparently, a poor South American harvest, the apparent contribution of Net Exports altogether is unusually large. In reality, it is economically insignificant, demonstrating clearly how GDP is put together to be the most charitable view of the economy.
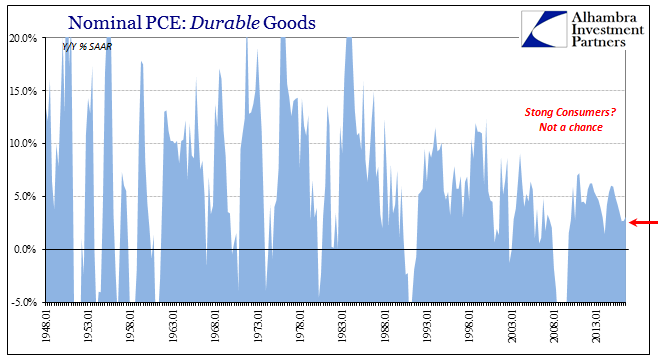
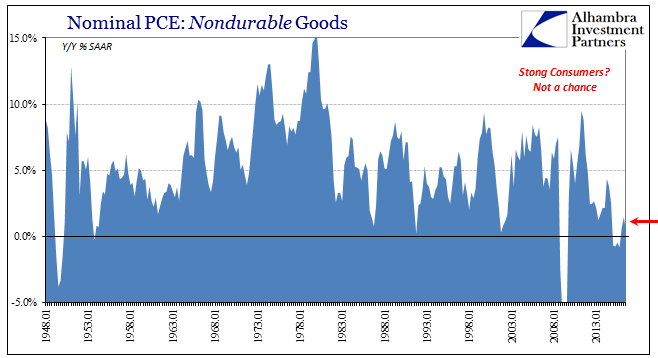
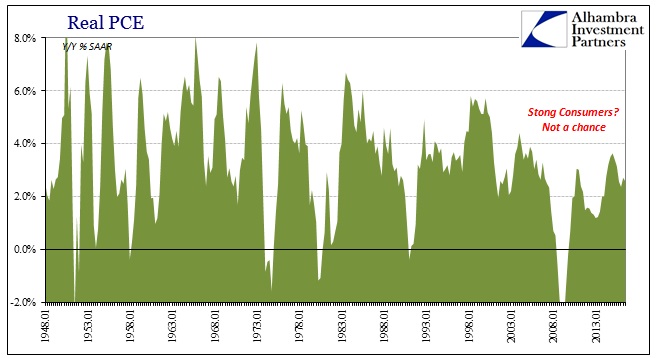
The rest of the report, what actually counts in the real world, is the same as we have seen for several years now. Consumers continue to show weakness or exhaustion while at the same time the media writes innumerable stories about the instead “strong consumer” despite no evidence for them. Growth in the trade of goods continues to be non-existent, following what has already been years of historically weak increases in activity.
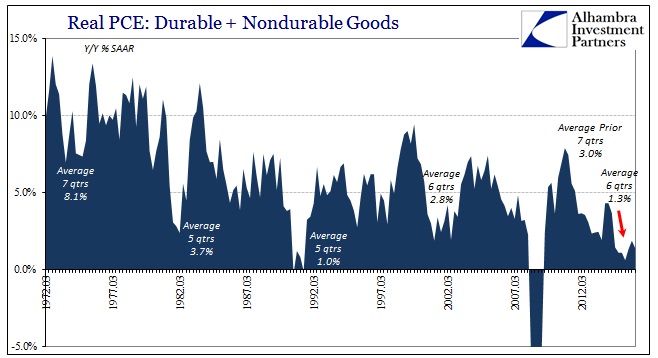
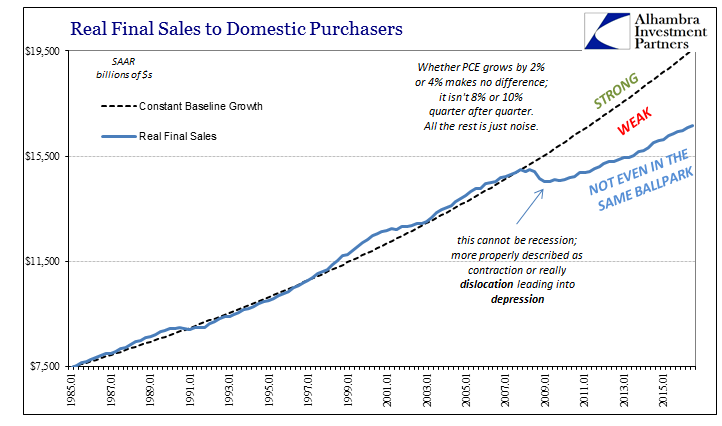
Even including PCE Services and all its imputations, the US consumer does not look any better. Total PCE growth year-over-year was just 2.58% in Q3, the fourth consecutive quarter less than 2.75%. Real PCE expansion averaged 3.51% in the dot-com recovery, 4.2% during the 1990’s after the 1991 recession, and 4.42% during the 1980’s after the double dip recessions that started the decade.
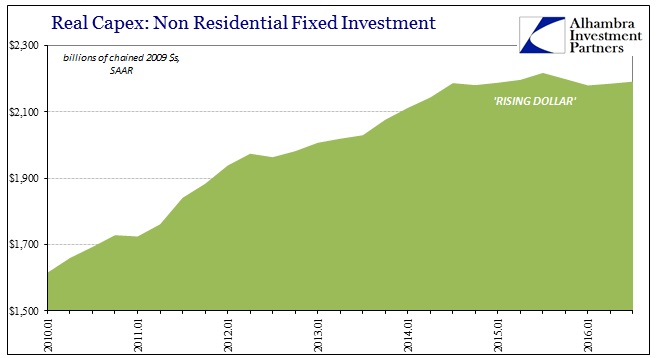
But as bad as consumers continue to be as a baseline economic trend, capex is where the economy is now hurting the most. Real Private Non-Residential Fixed Investment was just $2.19 trillion (SAAR) in Q3, up only slightly from $2.18 trillion in Q2, and about the same level of capex as each of the past nine quarters dating back to the start of the “rising dollar.” Even if this lack of growth were all about oil prices, it would still be significant in that there aren’t any other economic sectors expanding robustly to offset reduced energy production investment.
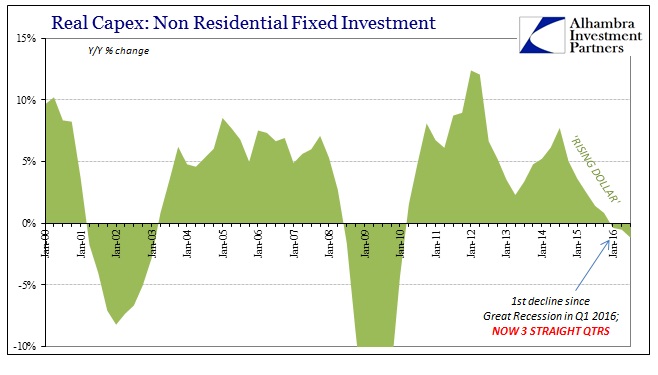
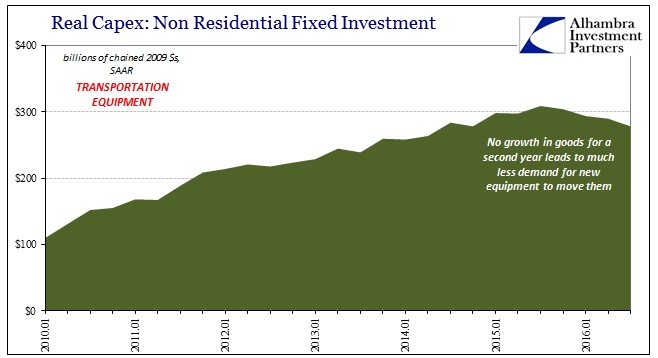
In truth, however, it is much more than oil. Growth in IT equipment as well as industrial investment continues to be subdued while the rate of purchases in transportation equipment is down significantly and steadily all the last year. The net result is that Real Private Non-Residential Fixed Investment has declined modestly year-over-year for the third consecutive quarter in 2016, a result usually observed for where the economy is in recession.
All of these NO-GROWTH sectors of the economy, which are all, again, the actual meaningful pieces, look like the other economic accounts that we have seen over the past few years stagnating (at best). It isn’t recession but it isn’t growth, either, especially as in too many cases it is closer to the former than the latter. That would be trouble in any time period, but following years of already low growth it can only lead to the same sorts of imbalances and negative factors.
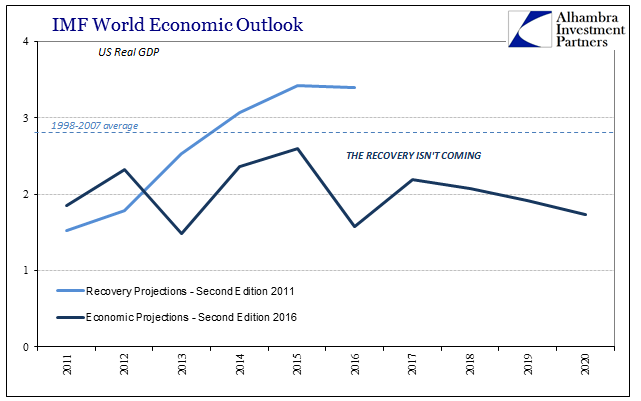
In terms of GDP, what this consistency underneath shows is that variability in the headline is in this economic context largely irrelevant. That GDP tends to anchor that volatility too often too close to zero is important. As such, the overall “cost” of this depression, which is what really matters, only gets larger. Until GDP starts hitting 4% and then 6% quarter after quarter, this is all just wasted emotion. Even the IMF figured that out finally.
But because 2.86% this quarter is more than 1.40% last quarter, it will actually be a significant impediment to real recovery. That growth rate isn’t even “good” by historical standards, yet it will be interpreted that way just as other less bad quarters have over the past five years. As a result, the public largely remains confused especially where GDP figures like this one will be heralded as proof that weakness is over and good times are just around the corner. People forget, as the media seems to, that all those other “good” quarters amounted to the same false hope. It keeps most people hanging on to the recovery narrative for a little longer when by any actually meaningful context there never was one – and so long as conditions remain as they are, there won’t be one.
Stay In Touch