
When the estimates for factor orders were released earlier this month, there was an unusual pattern for the revision of September’s preliminary figures. Subsequent data suggested that factory orders were slightly less than had been originally calculated, yet despite that result for the unadjusted data the seasonally-adjusted estimate for factory orders in September was instead revised significantly higher. Overall, the trend being displayed in the adjusted numbers is quite different from what is indicated unadjusted.
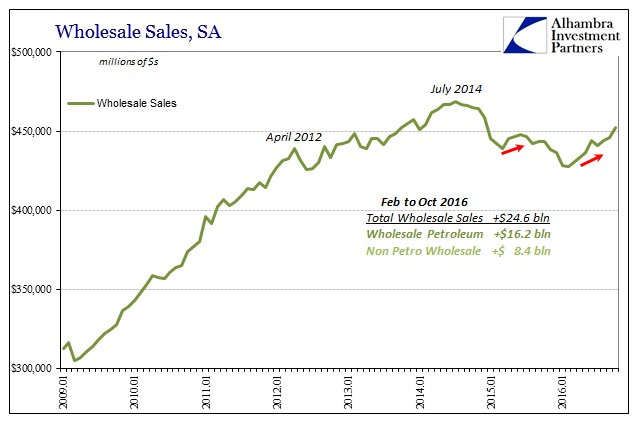
That also seems to be the case for wholesale sales. Unadjusted wholesale sales were reported last week to have been revised up by just $275 million in September in the unadjusted series, which turned into a +$1,128 million upward revision to the SA series. For October, the month-over-month gain for wholesale sales was a sharp 1.4%, nearly 2% year-over-year. The unadjusted estimate, however, was a much different result even to the point of a different sign, down 0.8% also year-over-year.
Going back to February, wholesale sales have been essentially flat year-over-year in the unadjusted series, but with a negative tendency. Sales were up less than 1% in February and March 2016, during the worst of this year’s start, before falling rather sharply (-5.4%) in April. Sales were flat again in May and June (+0.3%, -0.7%, respectively) before dropping 6.7% in July and rebounding by 6.6% in August, essentially no growth to start summer. The last two months of estimates, for September and October, are back to flat again (0.6%, -0.8%, respectively).
After contracting throughout 2015, flat in 2016 means the economy fell – and then failed to get back up again. That is consistent with the data we find elsewhere, including, importantly, the broad survey of labor statistics outside the isolated unemployment rate. The seasonally-adjusted data for wholesale sales, like factory orders, however, delivers, again, a very different impression.
Here we see an economy that was knocked down but appears to be getting back up again. If there has been improvement it is only that the rate of contraction is back to near zero.
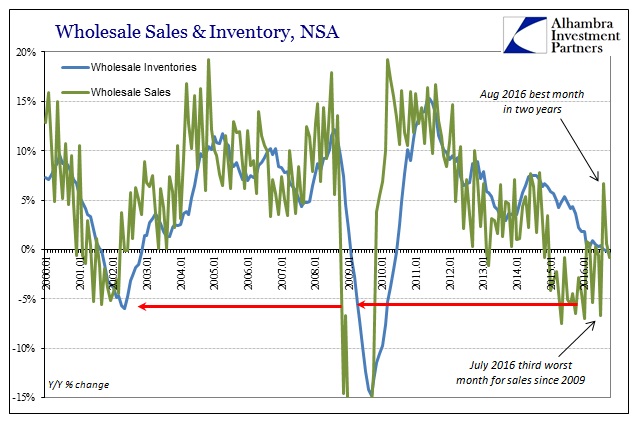
The bigger problem for the economy thus remains inventory. For the second straight month, wholesale inventory contracted year-over-year (unadjusted). Throughout this year in sharp contrast to last year, inventory growth has been subdued or stopped. But that isn’t the same as the sharp drawdown you would expect setting up for, and during the initial stages of, an economic rebound. In terms of manufacturing and the goods economy, it is the serious destocking of inventory (usually through recession-levels of discounting and contraction in orders for new goods) that leads to the sharp increase that is recovery down the supply chain. Instead, like the CPI and factory orders, there is just meandering suggested here.
That condition has been extended to the auto sector, where wholesale inventory of autos is slightly less this year than last as marginal production (and imports) is brought offline. These cutbacks in manufacturing appear to be more responsible for the relatively minor decrease in the inventory extreme than a measurable and meaningful improvement in the sales environment.
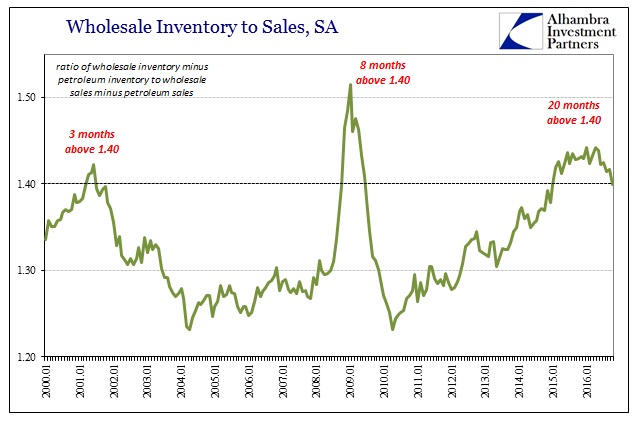
Because of the slow contraction in inventory (adjusted as well as unadjusted) combined with the seasonally-adjusted gains in sales, the inventory-to-sales ratio (non-petroleum) fell just barely (1.39942) below the 1.40 level for the first time in 20 months. If inventories continue to decline regardless of whether sales are actually slightly up or not, the ratio could continue to improve but, finally, at the expense of further marginal production. It’s not at all the same as recovery processes, instead consisting of an unusual and delayed supply side response to sustained weakness in “demand” that lingered for more than a year before it was considered “real.”
The marginal direction of the economy for both supply and demand, production and consumer, is obviously important and I don’t want to reduce the emphasis on the interpretations here too much. But in the wider context of what is going on, this all amounts to splitting hairs. This is the legacy of positive numbers, where even if the seasonally-adjusted numbers are an accurate reflection of the sales side it still doesn’t matter as they would still indicate the same general affliction as throughout.
Wholesale sales in July 2014 were 6.4% (unadjusted) above those in July 2013; in September 2014, two full months into the “rising dollar”, year-over-year sales were up almost 8%. Those figures seemed consistent with an improving economy that Janet Yellen was always talking about; that the US (and global) economy had finally shaken off the doldrums of the Great “Recession” and was poised past the events of 2011 and 2012 to finally take off.
Yet, even in those numbers there was cause for only concern. When the recovery finally arrived in 2004 after years of similar sluggishness following the dot-com recession, wholesale sales were growing at an average of 13%, not occasionally 6% or 8%. The 6-month average gain in August 2004 was 13.3%; the “best” the sales average produced in 2014 was 5.2%, and that with the “big” jump that September. Even during the sustained (artificial) growth period under the housing mania, the average gain in wholesale sales was consistently around 10%.
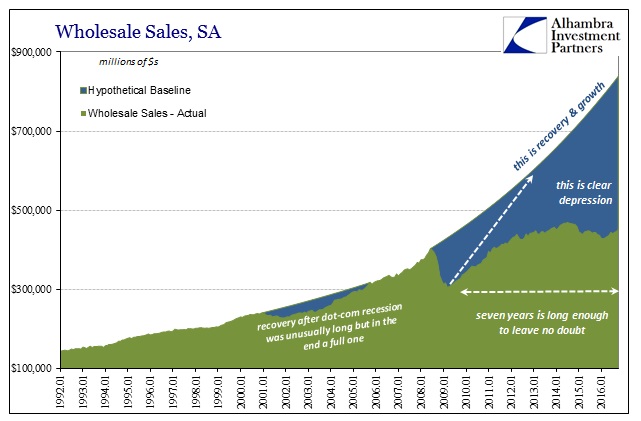
In short, even at the “best” point of the past five years, “growth” still didn’t measure up to past periods let alone to those plus the huge contraction in 2008 and 2009. A real recovery and overheating would have meant, in wholesale sales, at some belated point growth rates more like we used to find in China. We can even put a number on the scale of these discrepancies; had the Great “Recession” actually been a recession, wholesale sales would have been, seasonally-adjusted, $839 billion in October 2016. Even factoring the estimated “gain” in the adjusted data for most of 2016, they still fall $387 billion short at just $452 billion.
Reflation, as I suggested about oil prices as the “next” $50, is not going from outright contraction to flat, weak but not getting weaker; it is about going from $452 billion SA to $500 billion and then $600 billion and taking much, much less than a decade (or two) to do it. There is absolutely nothing like that indicated here, as what we find so far this year isn’t even close to 2014 let alone recovery let alone overheating. Sales even at positive rates just two years ago were indicative still of “something” holding the economy back. In late 2016, we are still at the stage where we aren’t even sure these positive numbers are actually positive.
Stay In Touch