
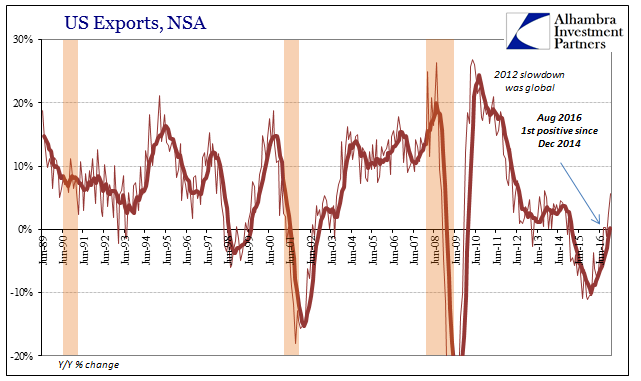
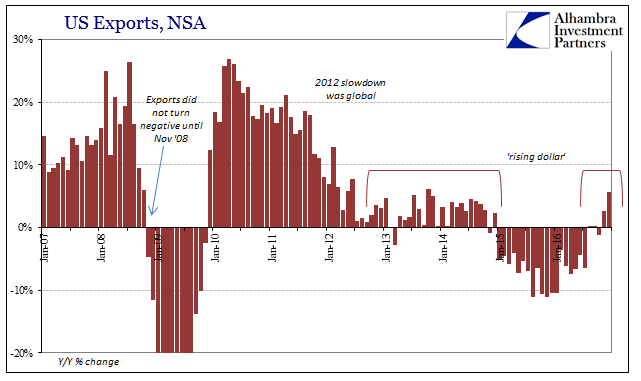
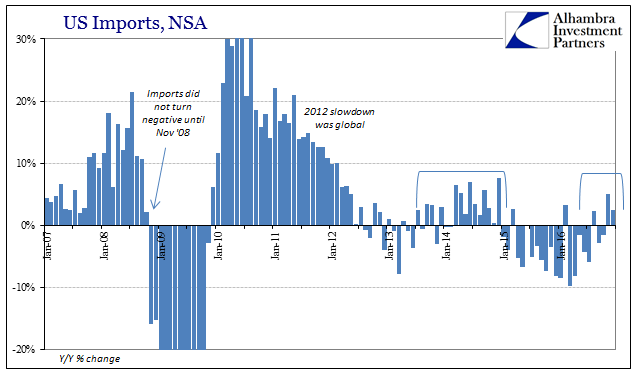
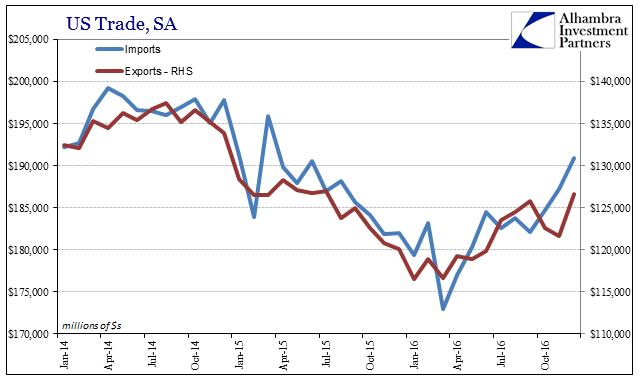
US exports grew by 5.6% year-over-year (NSA) in December, the fourth gain in the past five months. It was the highest growth rate since October 2013. On the incoming trade side, imports advanced 2.4% year-over-year after rising 5.1% in November. Those were the first consecutive monthly increases since the last two months of 2014. The trade figures add further evidence that having skipped recession to start 2016 the global economy has now moved past that specific danger.
In other words, we have cycled beyond slow and steady contraction, one that lasted about two years (and more in some places) but back only into slow and steady positive numbers. Neither of those conditions equate to actual, meaningful economic growth in large part because the latter never makes up for the former.
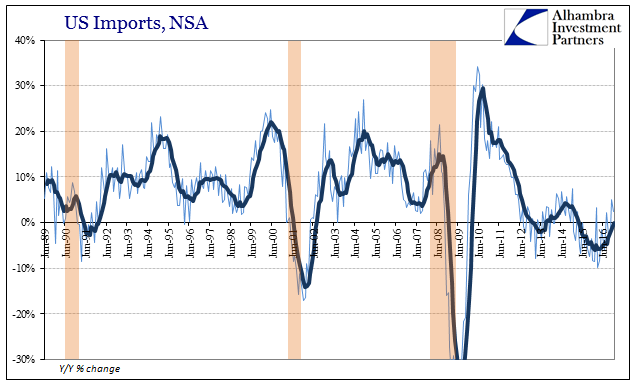
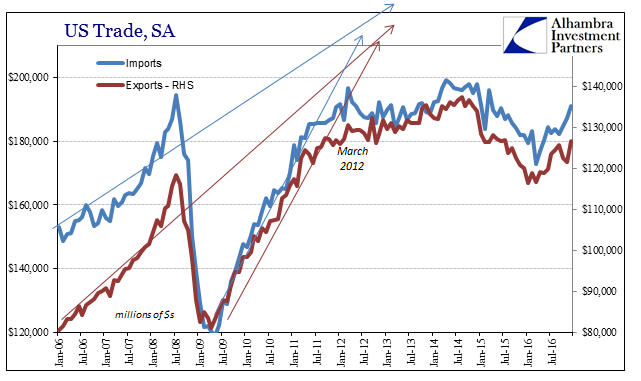
The seasonally-adjusted series suggests a somewhat sharper pickup in US imports in the last two months of last year. Given wholesale inventory data, as well as estimates for the same in the GDP figures for Q4, that would seem to suggest restocking as the primary marginal culprit.
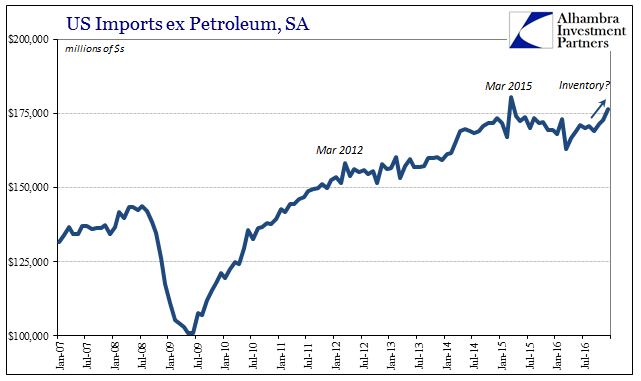
Excluding the import of petroleum, which has retraced only somewhat in 2016, it does appear as if there is a strong correlation between inventory and US import activity (as has been the case, and would be expected to further be the case).
Both the export and import data would also be consistent with rising sentiment indicators, including PMI’s both here and elsewhere. Questions remain, however, as to a possible “sentiment premium” where these surveys are unable to distinguish between lack of further contraction and sustainable recovery. The latter is what is usually believed the case at these times when in fact, as we experienced just three and four years ago, it was instead the former.
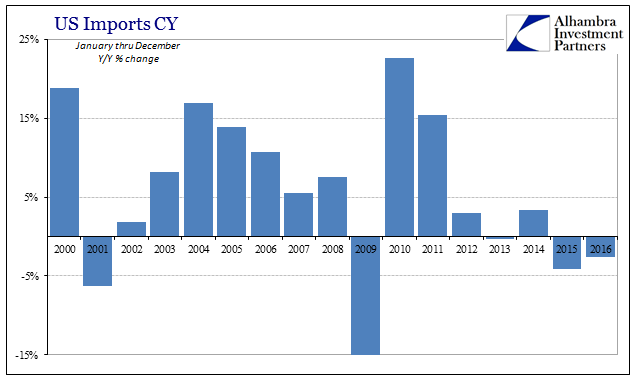
That difference can be illustrated best by the annual data, where the importation of goods was negative in 2016 for the second consecutive year. Though that contraction was front-loaded to the “global turmoil” that started it, slightly positive numbers at the end of last year are still inconsistent with normal growth after just such an extended slump. In non-petroleum terms, the same interpretation applies where import activity was in absolute terms worse last year than the year before.
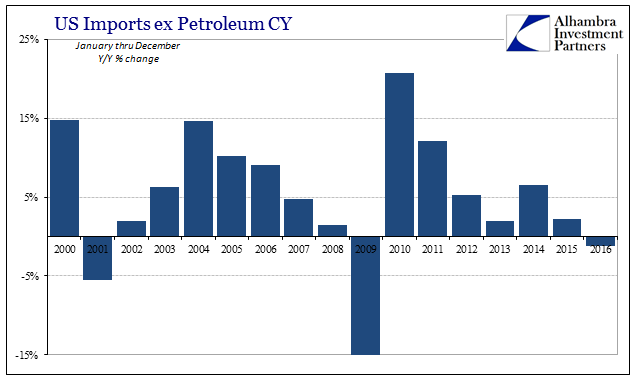
As these figures relate to actual economic function, however, there really wasn’t any meaningful difference between the 2.2% growth of non-petroleum imports in 2015 and the 1.2% contraction in 2016. Neither is anywhere close to what the rest of the world requires to sustain their own economies that despite mainstream rhetoric are still very closely tied to the economic situation as it was in 2006.
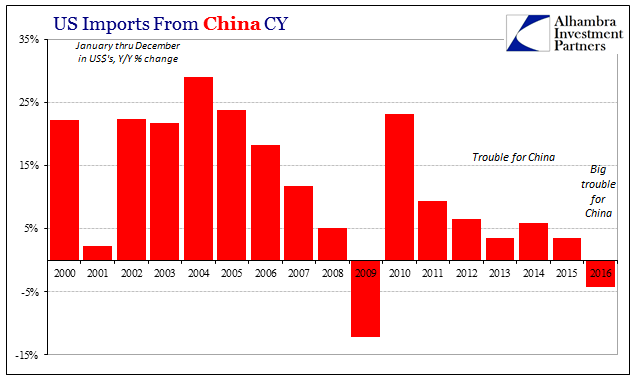
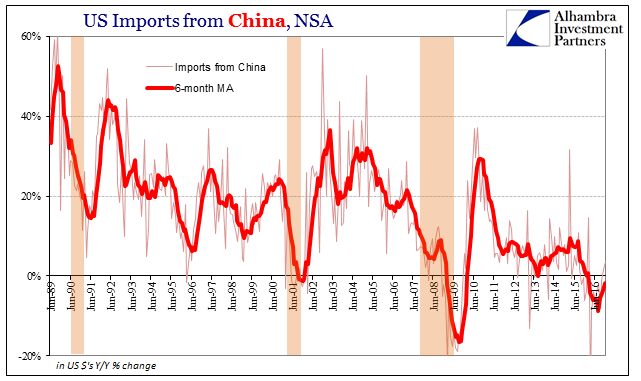
Nowhere is that more evident than, of course, China. Though US imports from China, like the overall figures, have returned to the plus side it is still in the smallest of numbers. Imports from China increased 3.6% in December, which actually matches the full year growth rate from 2015 when the “rising dollar” really started to play havoc.
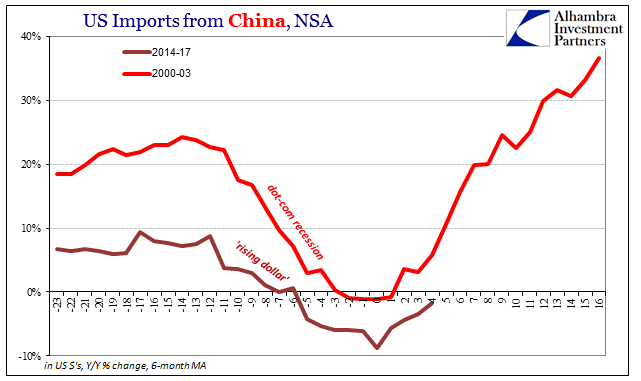
It’s one big reason why fiscal “stimulus” was added in large quantities early last year in China but produced little to no detectable positive effect within the Chinese economy overall. The difference can be seen by comparing US import activity after the dot-com recession with it so far after the near-recession in late 2015/early 2016.
Officially, the NBER dates the trough of the 2001 event as in November that year, and from there it only took a few months for US demand for Chinese goods to resume the trend from 2000 and before (and in short order surpass it). The last negative number in terms of US imports from China was estimated to have been -4.4% for March 2002. The following month, growth had resumed at +18.4%, and then 26.9% the month after that. By April 2003, the 6-month average was nearly +37%.
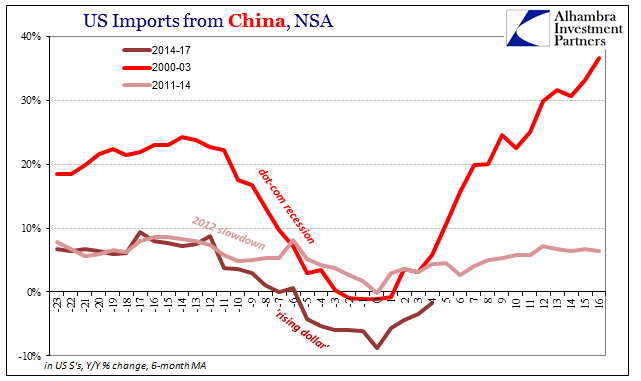
The difference between these two periods explains why the Chinese had appealed to so much “stimulus” last year, and practically none in 2002. Despite the fact that on average the contraction in US demand was significantly worse this time around as compared to that prior declared recession, there is nothing to indicate a rebound forming at even a fraction of the 2002-08 pace.
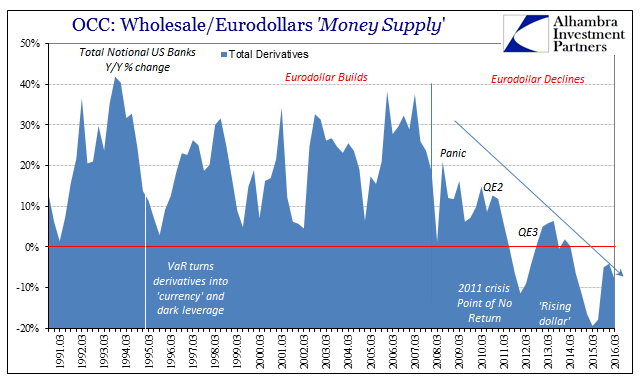
What is indicated in 2017 is a replay of 2013 or 2014; the same reductive cycle where the baseline isn’t for growth but alternating periods of sluggishness and slow contraction. It is the perfectly sharp contrast between eurodollar growth and its extending decay.
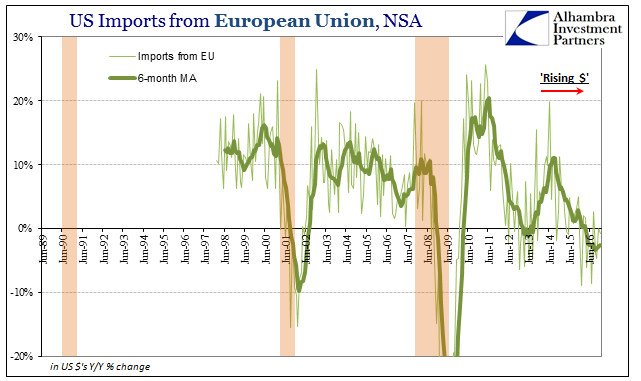
The lack of actual growth applies to far more than just the Chinese experience of US depression, as it is a global problem or depression. US imports from the EU, our second largest trading partner, declined slightly in December after being merely flat in November. The 6-month average is still -2.5%, not significantly different than the lowest estimate (-3.3%) from September.
We are in all likelihood stuck in the same place, poised for another go around wasting that many more years. The absence of further contraction as in 2013 and 2014 did not mean the start of reflation or recovery, rather it meant the huge disparity between hope for it and the reality that continues to be nothing like it. Because of the positive numbers, urgency receded in favor of a positive assessment of QE3 (and 4), and in all likelihood will do so all over again on whatever might be attributed to them this time.
Economists the world over, the same ones who missed the “rising dollar” weakness, will pronounce the global economy stabilized (many have already done so) by doing the same of the large constituent economies within it. They can do that only because convention considers economic analysis solely as a function of a plus or minus sign. The actual, appropriate standard of analysis is instead time, as it has been since 2011.
Stay In Touch