
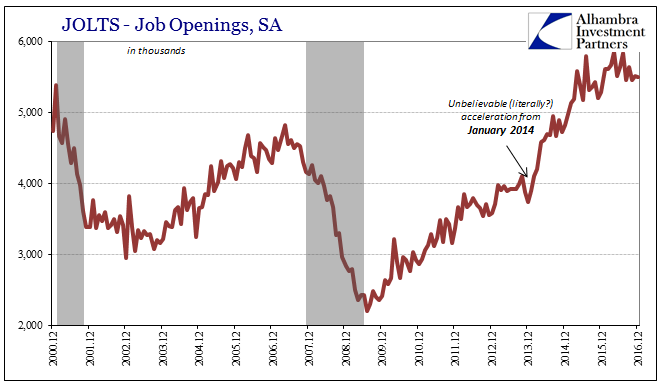
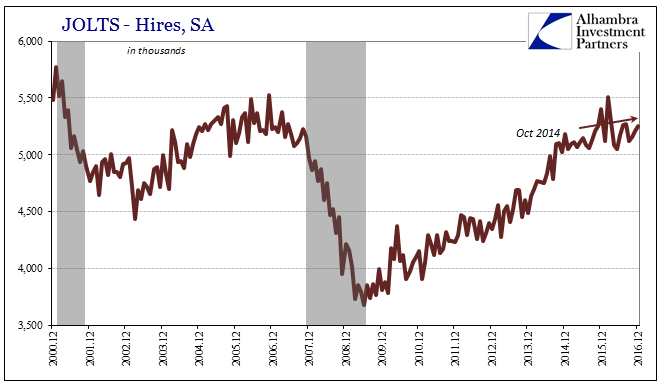
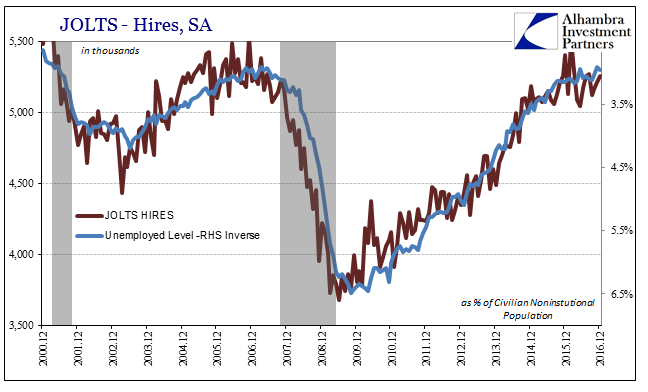
There were no surprises in the updated JOLTS estimates for December 2016, just more of the same sideways. The level of Job Openings was 5.501 million (SA), practically unchanged from November’s 5.505 million. The BLS estimates that Job Openings have been stuck at around that level since April 2015. In terms of Hires, that series, too, was practically unchanged in December from November (5.25 million vs. 5.21 million) and more or less sideways all the way back to October 2014.
From this data we can further assume that the near-recession in 2015-16 was as significant as the term sounds, as the actual economic process penetrated the BLS data in ways that the 2012 slowdown did not. Illustrating this difference in severity is the year-over-year comparison in the rate of monthly hiring activity.
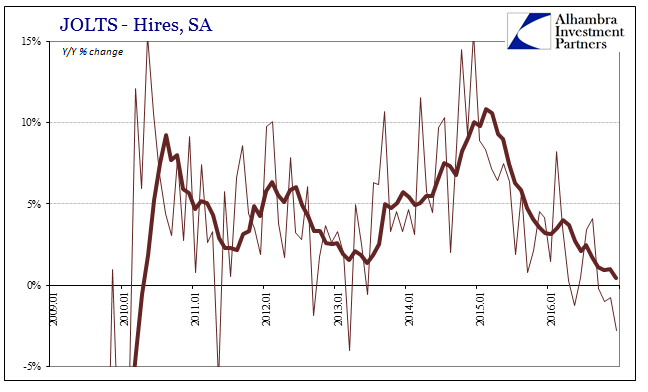
December was the fourth consecutive month of comparatively lower levels, and five out of the last eight months. The 6-month average is down to near zero, suggesting that whatever happened overall in that period of “global turmoil” was enough to bring the US economy to a halt if not quite into full-blown contraction.
Labor market figures, indeed labor market function, is mostly backward looking, however, and with most incoming economic data indicating the economy having moved past that period it might propose these figures outdated and overtaken by that turn. It would not, in fact, be surprising if in the coming months the overall payroll data (beneath the headlines that never really changed) in addition to JOLTS starts to look somewhat better as a lagged response to that rotation. Because of that, we have to turn our attention to assessing what that might actually mean using the data available. As such, even lagging numbers are of use in at least setting the baseline for expectations.
Primarily our concern is whether absence of further slowdown/contraction will mean the same as 2013-14 or closer to actual recovery and sustainable growth. The labor market figures including JOLTS would propose the latter, while economic estimates outside BLS data are far closer to the former. In the JOLTS data alone, both Job Openings as well as Hires are more like 2007 than 2009 or even 2012.
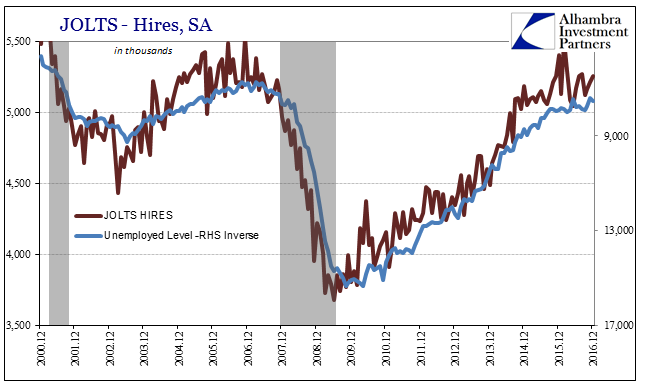
Furthermore, the Hires figures closely align with other BLS data such as the absolute level of unemployed. The BLS estimates the total number counted as officially unemployed fell to 7.4 million in November 2016 (picking up slightly in the two months after). That is down from almost 9 million at the start of 2015, and 15.3 million at the worst point in 2010. The correlation between the level of Hires and the number of unemployed is practically self-evident, and needs little explanation. What deserves our attention is analysis as to whether it is real or statistical in this case.
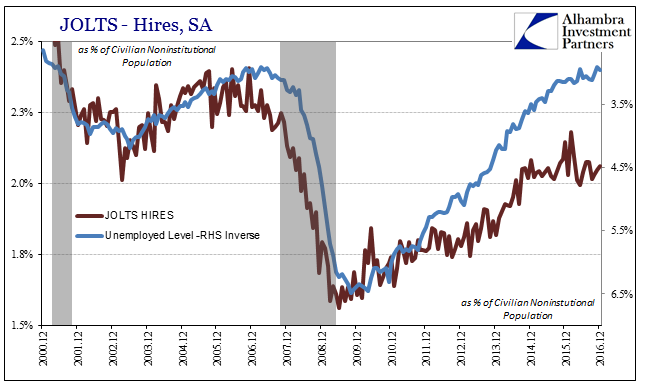
If we apply the official level of unemployed persons to a population control, we find that it fits even better with the Hires data – almost perfectly.
That’s actually a big problem because if we apply the population control to Hires as well, it opens up the major deficiency as with all of the labor data.
The rate of Hires is actually significantly less at the end of 2016 when adjusting for population growth than in 2006 or early 2007. The reason for the difference is how the BLS accounts for who is “unemployed” and who isn’t. In other words, if that official definition of the unemployed was consistent, then the rate of Hires would actually be considerably more than they are, more like 6.0 or 6.1 million than 5.2 million.
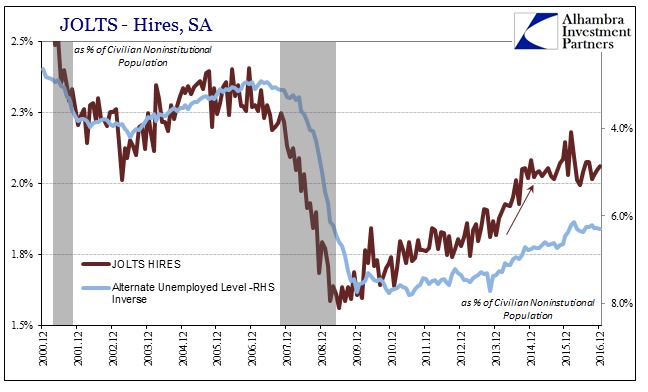
Using a constant participation rate instead of the official definition of who is unemployed, the comparison to Hires is more fruitful. In fact, the path of the JOLTS number seems to have split the difference between the official figures and my alternate scenario. That would suggest two factors accounting for it, both the overestimation of labor market strength especially in 2014 as well as Baby Boomer retirement.
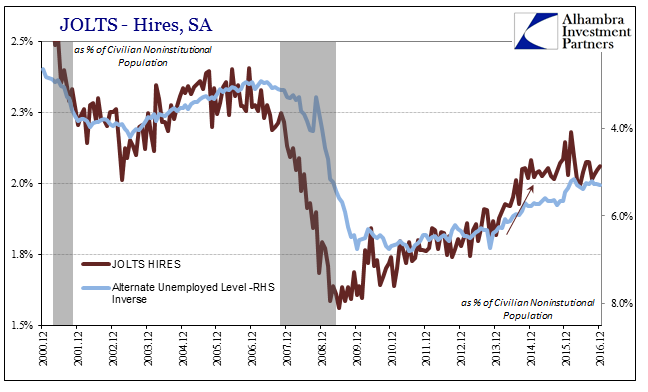
Using a constant 65% participation rate (above) rather than the 66% rate that prevailed prior to the Great “Recession”, the two data series are somewhat closer as a match. It proposes the very limited effects of Baby Boomer demographics as to why official stats can’t harmonize with economic reality.
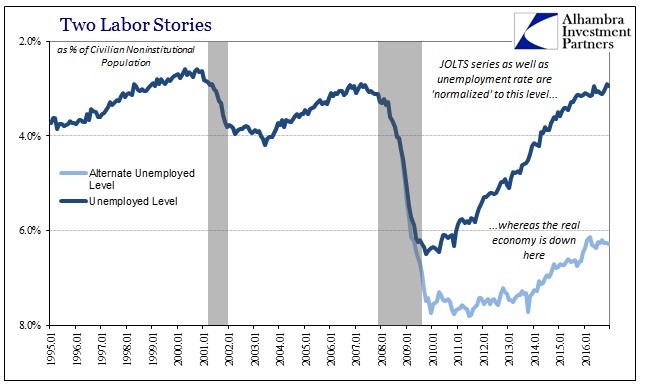
That is where we are going with all this, namely that there are and have been two “realities” of sorts when it comes to labor market data including JOLTS. Almost all the BLS figures conform to the version where the level of unemployed in the US is practically the same as it was at the last cycle peak. That suggests normalizing in the real economy and something like full healing, and thus if the US and global economy has indeed moved past last year’s significant weakness then we might consider brighter even normal growth prospects.
The alternate path, however, shows all the ways those expectations might be far too optimistic as well as why that has been the case going back to the trough of the Great “Recession” itself. Not only is the economy weaker now, the contraction during the Great “Recession” might have been worse than it appears in the BLS numbers. These points have already been proven several times over, including in 2014 as the unemployment rate indicated one thing to economists whereas these alternate figures suggested quite the opposite. It isn’t just statistically altered data that exemplifies this difference, however, as we can use the both the official labor force as well as GDP to corroborate them.
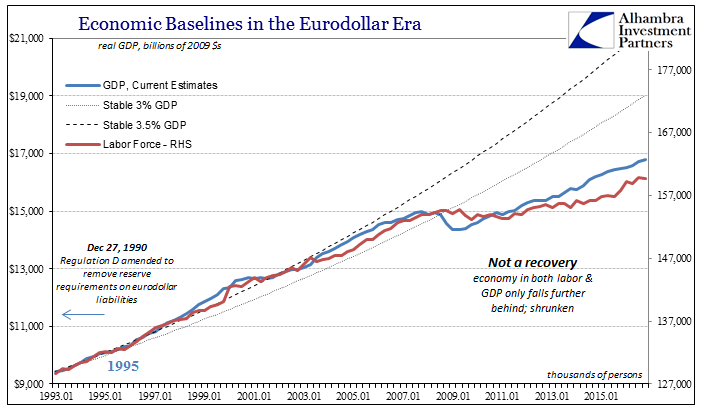
In other words, there is far more consistency in this alternate view than of the unaltered mainstream data (a difference that is perfectly displayed by productivity estimates which are supposed to bring together and confirm BLS data about the labor market with BEA estimates of output but haven’t been able to, often times to glaring irregularities). As always, this is much more than an academic review of the situation up to now, as it provides a more reasonable basis for which to analyze what might come next.
The difference between the arrival of actual growth and a repeat of 2013-14 is enormous, one that is likely being considered again where not long ago unbridled “reflation” once stirred some optimistic energy. All perceptions about future “stimulus” must take into account this starting point. In other words, the task ahead is not about stimulating the economy as it is, hoping to make it a little better along the way, but rather figuring out that the economy shrunk then considering why it did and doing something about it before we waste that much more time applying the wrong solutions to the wrong problem because of wrong data.
Stay In Touch