
At the end of February, FRBNY President Bill Dudley made what was a widely shared remark that “animal spirits had been unleashed.” Confidence of just this sort is exactly what monetary policy is after, using all kinds of tools by which to get people happy about the future. According to rational expectations theory, which guides every post-Great Inflation model, if people feel tomorrow will be better and are very confident about that feeling, then they will act today in anticipation. It’s not monetary policy without money so much as pop psychology.
The job of the Federal Reserve through this channel sounds really simple – provide these “animal spirits” with a credible, plausible basis by which to be sustained and amplified. From stocks to inflation expectations, the QE’s were supposed to instill this kind of foundation for full recovery.
Dudley’s comments six weeks ago, however, were not in relation to QE but rather the election. In that way, his remarks were almost damning of monetary policy because the world at the time looked a lot brighter for reasons that had little to do with him or the FOMC. But this was not the first time confidence and spirits had been unleashed, for the same could have been said, and was, about 2014 and early 2015 (which were attributed to the success of QE and its presumed positive boost in confidence).
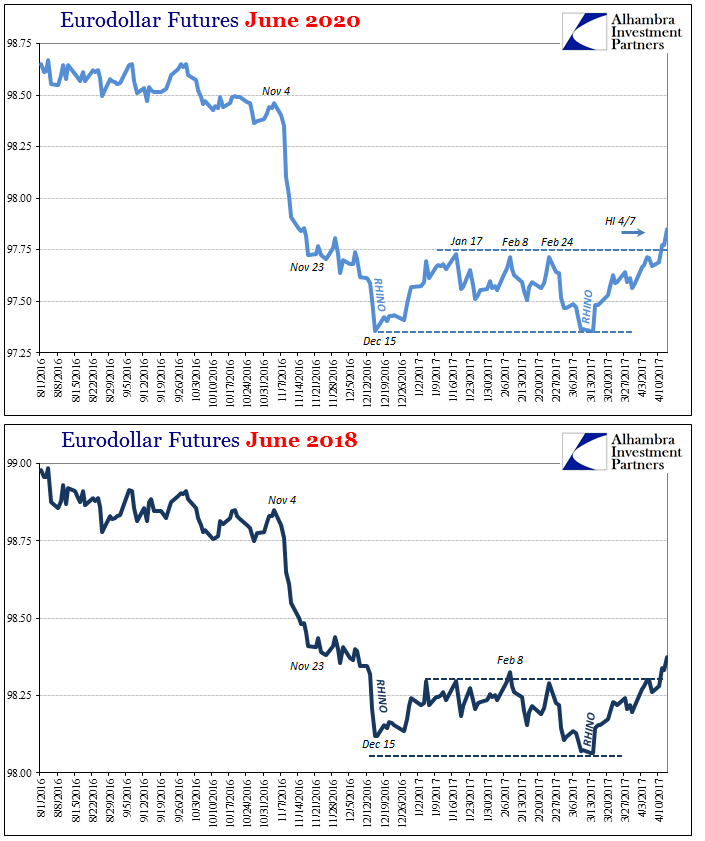
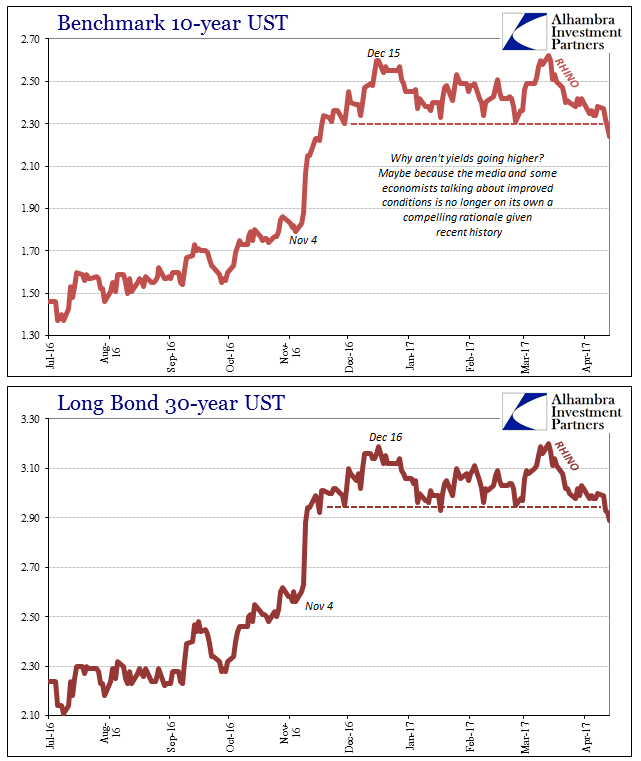
Yet, ever since the Fed last “raised rates” in mid-March it’s as if the whole thing fell apart. From almost the moment the FOMC published its “hawkish” vote, risk aversion has been the dominant force once again. It is contrary to everything we are supposed to believe about monetary policy and what it means under these conditions. As Reuters wrote back on March 16, a good representation of convention “wisdom” about these things:
The U.S. Federal Reserve raised interest rates on Wednesday for the second time in three months, a move spurred by steady economic growth, strong job gains and confidence that inflation is rising to the central bank’s target.
There is supposed to be a robust relationship between monetary policy, inflation expectations, confidence, and then inflation and output. That is what “accommodation” means, and the end of “accommodation” therefore must mean the confidence stage is finally turning into the activity stage; animal spirits progressing from confidence into actual inflation and activity.
At issue is the Phillips Curve which governs the theories about these relationships. It was at first believed in 1960, only a few years after AW Phillips first described his findings, that intentional policy could trade inflation for employment. Because they appeared to behave inversely, any Treasury Department or Finance Ministry could undertake “inflationary” policies especially underwritten by its central bank and reduce unemployment down to the absolute minimum. This “exploitable” Phillips Curve as introduced by economists Paul Samuelson and Robert Solow turned out to be an epic disaster.
As economists Milton Friedman and Edmund Phelps instead tried to explain, the Phillips Curve would at best be expected to hold only in the short run. That is, in fact, what happened in the 1970’s, giving us a decade and a half of Economics being exposed for what it really was and remains (incompetent politics). The Curve itself shifted at that time exclusively to the right, with it taking until the end of it for central bankers to finally figure out that monetary behavior had a lot to do with that devastating rightward trend.
The exploitable Phillips Curve idea never truly died even though the theory was so discredited. It was instead “updated” by pairing its basis with rational expectations, so that in models, anyway, the hypothesized relationships might actually fit with reality. And there is a good deal of evidence for the Expectations-Augmented Phillips Curve, even during the so-called Great “Moderation.”

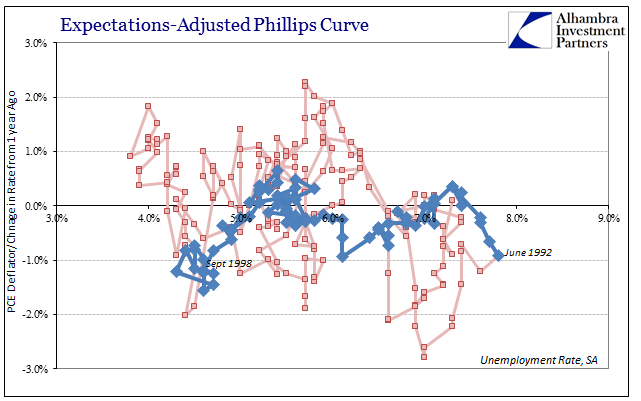
If we plot inflation (PCE Deflator) against the official unemployment rate, initially what we find seems to be a jumbled mess. However, if you look close enough you can discern three separate periods where the Phillips Curve visibly holds.
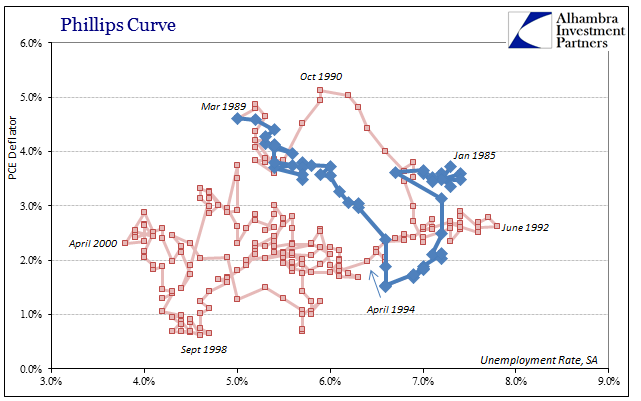
The first was the latter half of the 1980’s, the period after 1984 when the economy settled down to “potential” that was no longer a part of the Great Inflation paradigm. It is the classic Phillips Curve demonstrating about as conclusively as possible the inverse relationship between inflation and unemployment. This dynamic held past March 1989 well into and out of the recession of 1990-91.
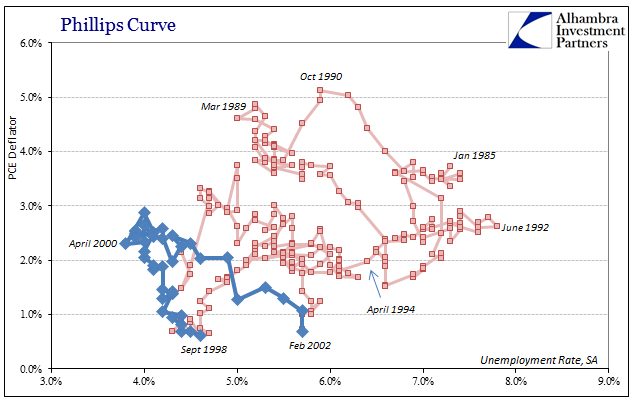
The Phillips Curve shows up again in the late 1990’s at the height of the dot-com era but noticeably shifted far to the left. This was the apex of the Great “Moderation” where it was believed a new paradigm of high productivity, due to the “maestro’s” monetary genius no less, had shifted it that far in a very beneficial (they thought) direction. As in the 1990-91 recession, the dot-com recession developed with a stronger relationship between inflation and unemployment (the latter rising, the former falling) on the way down than from September 1998 to April 2000.
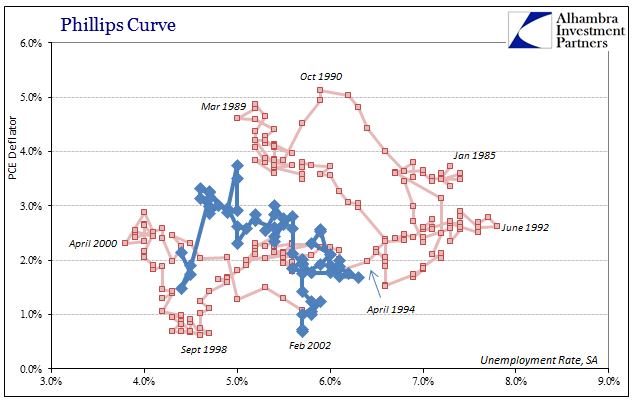
Quite unexpectedly, however, the Phillips Curve in the middle 2000’s shifted back in the “wrong” direction, coalescing in the middle. Though it was still presumed part of the Great “Moderation”, it wasn’t nearly so as at least compared to the prior shift. The productivity that policymakers and economist thought they had engineered for something like a permanent basis mysteriously dropped off. Even by the onset of the Great “Recession”, they were still puzzled by this:
MAY 2007 FOMC Meeting; MS. YELLEN But the hypothesis that the recent decline in productivity growth is mainly structural does not seem to me to square well with the broad range of available evidence. Recall that in the 1990s there was a whole constellation of evidence—including a booming stock market, robust consumption, and rapid business investment—that was consistent with a hypothesis of a lasting increase in the rate of productivity growth. In contrast, over the past year or so, business investment in equipment has been very sluggish and more so than seems warranted by the deceleration in business output.
Putting that commentary in terms of this review of the historical Phillips Curve, what she really saying was that officials and economists really didn’t have any idea what was making the short run curve move around as it did to those three very distinct periods. They assumed a great many causes, most of which could quite intentionally be traced to themselves, but in truth they had no idea. It’s not just a matter of academic curiosity, though, for all monetary policy, and therefore mainstream convention, is predicated on these relationships and the predictable correlations that are supposed to be determined by them.
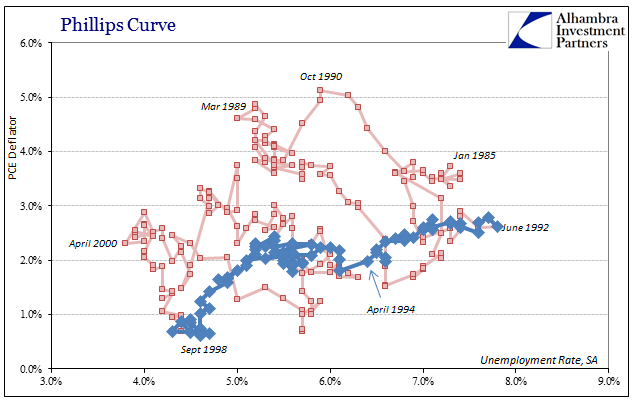
The best demonstration of contrary evidence to that contention is what you see immediately above. From the middle of 1992 when that first “jobless recovery” finally got started (not soon enough to save George HW Bush’s reelection) all the way until, quite tellingly, the Asian flu, the Phillips Curve had suddenly run backward. Both inflation as well as unemployment were falling together rather than inverse of each other. Because it was for six years and in about as straight a line as you could hope to find of economic accounts like this, it was not a trivial or insignificant deviation.
In very general terms, what is really shows it that “something” is missing from economic theory and convention (again). If monetary policy is the reason for the “Great Moderation”, using the updated Phillips Curve in part, it seems like some channel of causation is distinctly missing from how that might have been.
Again, this is not mere academic trivia, not the least of which because it happened again after 2011.
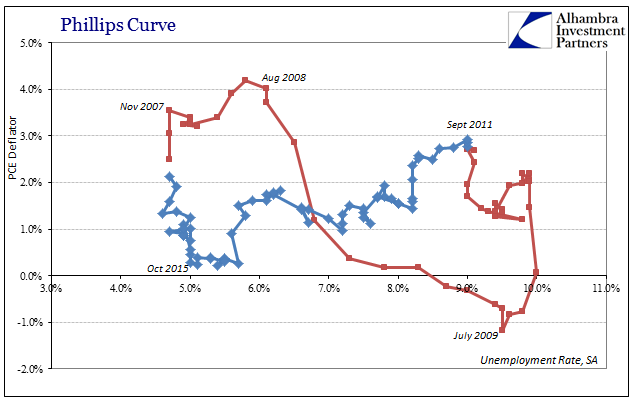
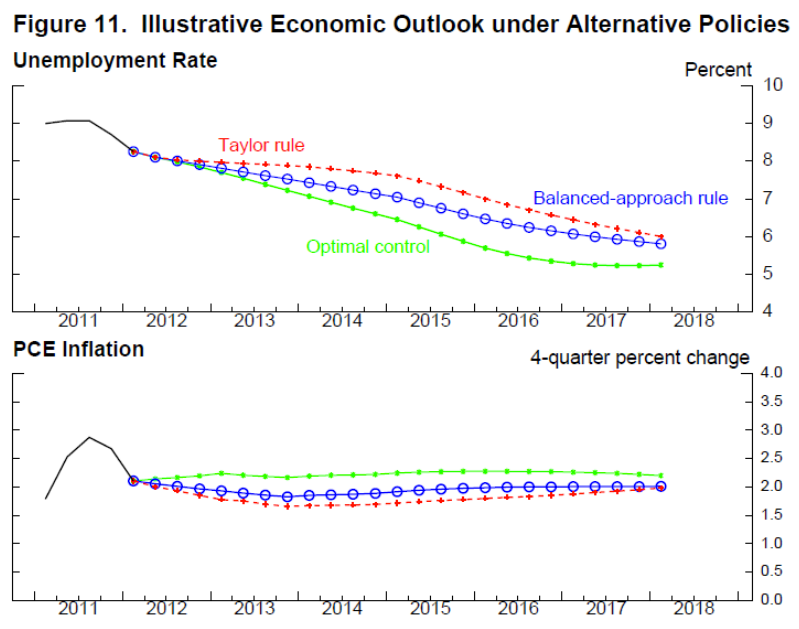
Like the middle 1990’s, this was no short run inversion. Lasting about 4 years, it begins unsurprisingly during right smack in the middle of the 2011 crisis. Unlike the earlier backward behavior, this one led to more obvious monetary mistakes including QE3 and QE4. As noted yesterday, monetary officials kept expecting the additional “stimulus” plus the adoption of “optimal control” (lower for longer) to act in the predictable short run Phillips Curve fashion.
Thus, it is entirely reasonable to conclude that during this stretch at least monetary policy was, as throughout the middle 1990’s, flying totally blind; officials really had no idea what was going on. These backwards results show up whether using the traditional Phillips Curve or the expectations-adjusted version, meaning it isn’t a measurement problem (or strictly tied to outdated theory).
What this tells us is that there are important and significant periods of time where dramatic changes take place and because they do so far outside the boundaries of conventional, accepted Economics they are left as unexplained mysteries. Outside of that, however, these are what they appear to be – a radically altered economic state that bears little resemblance at the end to what it was at the start. That is certainly true of the end of the 1990’s with respect to the beginning.
And it has come true again, for the US economy in 2017 is little like what it at least appeared to be capable of up to the middle of 2011. Now if “we” could only figure out why these changes happen.
Stay In Touch