
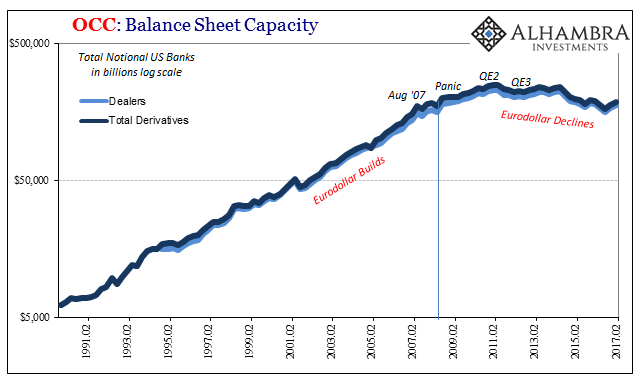
The Office of the Comptroller of the Currency (OCC) reports that total gross notional derivatives contracts owned and outstanding by domestic banks rose for the second straight quarter. The OCC statistics are one quarter behind, meaning that though banks themselves are reporting Q3 numbers with earnings all figures shown here are from the official compilation for Q2. As such, the general trend was closer in line with “reflation” than in the most recent quarter, but clearly in transition from a more thorough embrace in Q1.
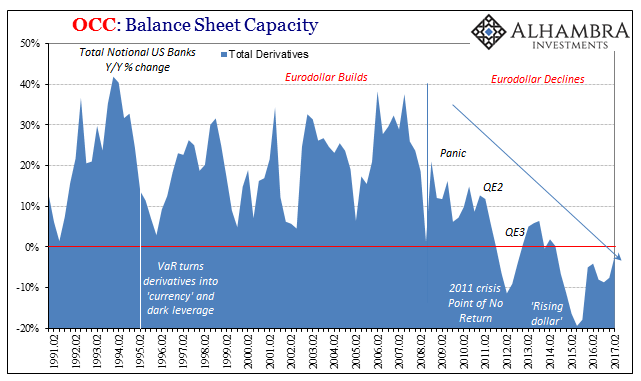
The increase in gross notionals fits with that characterization – a rise but still not much of one. The total for Q2 was $185 trillion across all types, up only 4% from $178 trillion in Q1. Year-over-year, however, gross notionals outstanding were still down 2.3%. It was the eleventh straight drop on those terms going back to Q3 2014.
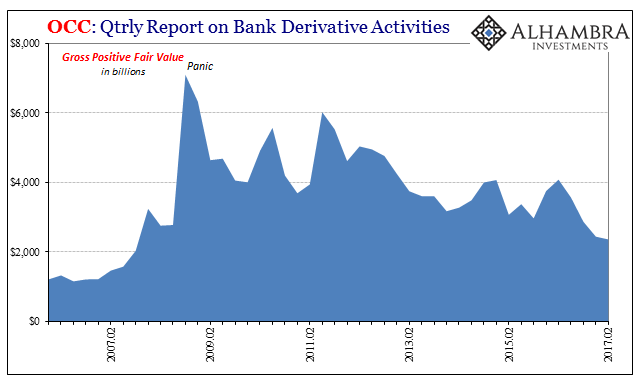
A good part of the reason for the diminishing rebound is credit exposure, a method of bank and regulatory control (for an explanation on GPFV, NCCE, and netting, go here). Gross Positive Fair Value (GPFV) declined again in Q2 but only slightly as interest rates stopped rising overall.
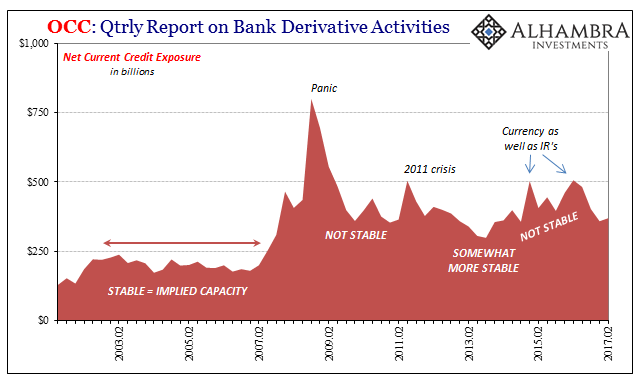
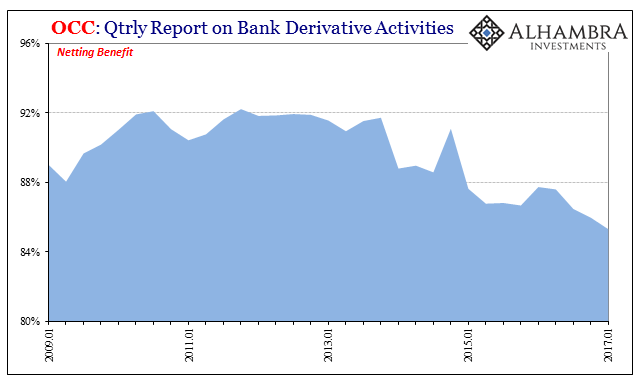
Despite a lower GPFV since Q2 2016 (and the beginnings of “reflation”), Net Current Credit Exposure isn’t down by nearly as much. The reason appears to be some issue with netting, or more likely the capacity of dealers to be able to systemically offset their risks through opposite contracts, cash settlements, or collateral posted. The calculated netting benefit was in Q2 2017 the lowest since before the panic.
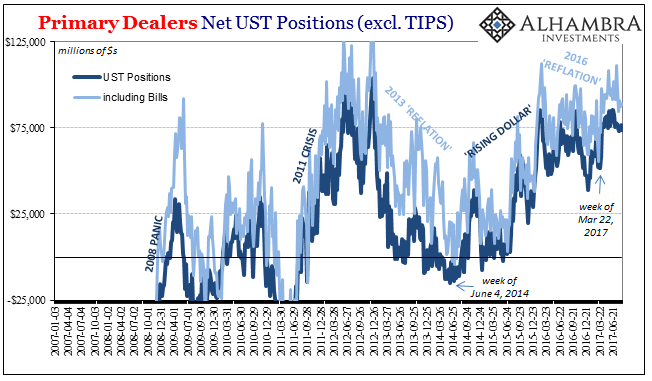
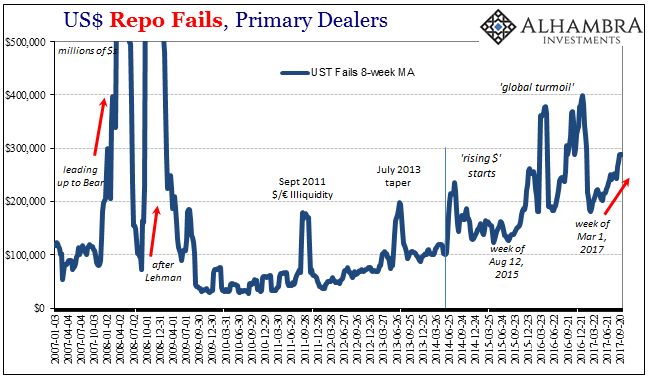
Unfortunately, the OCC report doesn’t give us any insight into why there might be so much difficultly netting at the same rates and levels as prior to the “rising dollar”, though in this case we aren’t out of line for reasonable speculation. I can’t help but notice the baseline correlation since 2014 between rising repo fails, hoarded dealer UST’s, and now the lower netted derivative exposures.
It’s another layer of risk control/management that appears systemically weak or even deficient that can only contribute further to the all risk/no return paradigm that is the post-2007 eurodollar system. Even when dealers catch a bit of break (lower GPFV) it is muted by another factor.
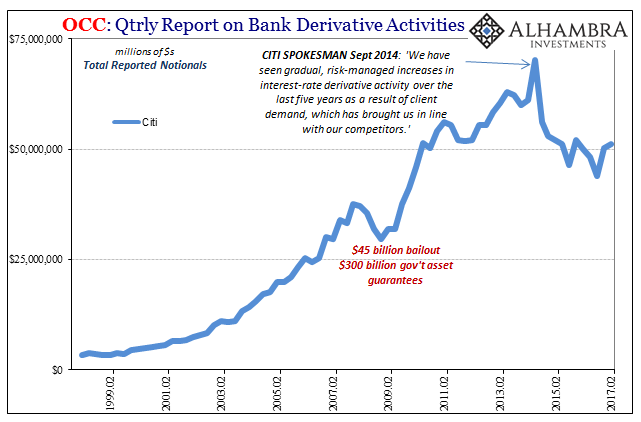
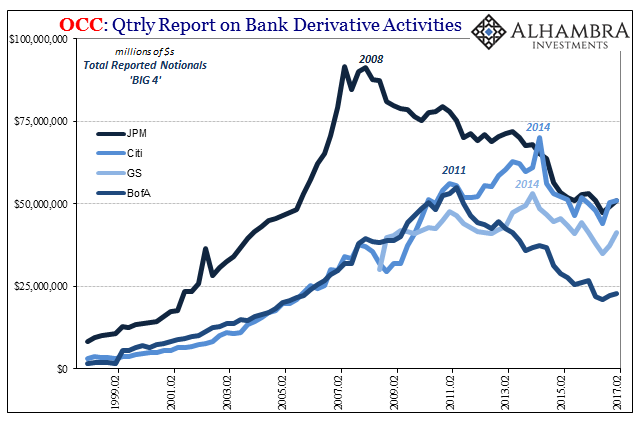
Citigroup for the second straight quarter was on top of the Big 4 derivatives dealers. All four firms increased their exposures in Q2, led by Goldman Sachs (+11% Q/Q) who may be regretting the aggressiveness. The other three were more restrained, with JPM second in growth at just 3.8% (Q/Q).
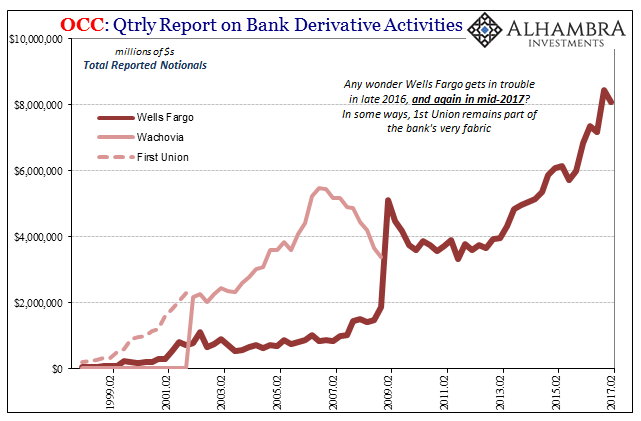
Outside the top dealers, Wells Fargo had been very assertive in derivatives exposure. The bank, however, has since been caught up in a whole bunch of negative (some criminal) schemes, which may account for a 4.3% reduction in its derivative book in Q2. If it continues in Q3 it will confirm as much.
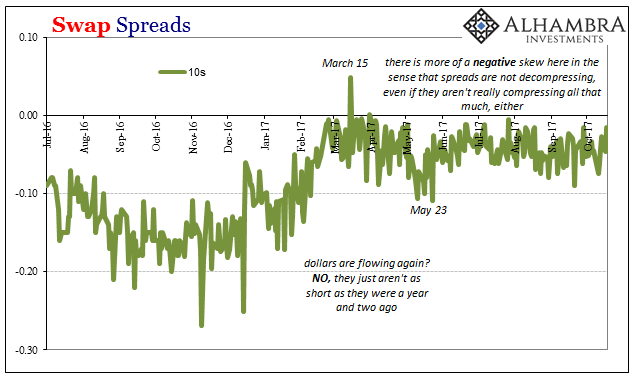
Total forex derivatives were flat in Q2 compared to Q1. That might help explain the behavior of cross currency basis swaps since the beginning of the year. After a big jump in Q1 for forex gross notionals, accompanied by a sizable reduction in negative basis swap premiums (an explanation of basis swaps as a matter for the “dollar shortage” can be found here) for all three major currencies (yen, euro, pound), there was less or little price eagerness in Q2. Basis swap premiums in that second quarter flattened out or plateaued rather than having gone back closer to, or even as far as, parity.
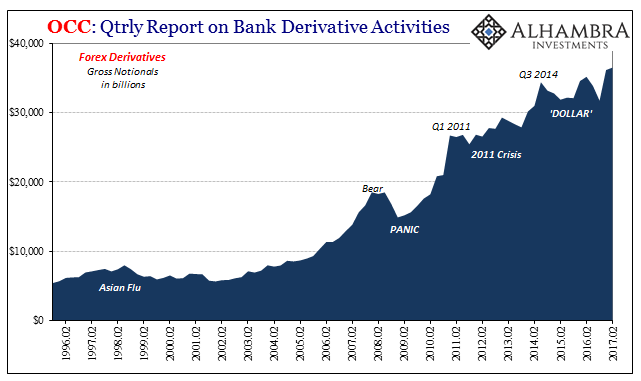
There has been a whole lot of chop and volatility in the FX space going back to 2014, and it seems as if that has continued in 2017 despite (or because of) miniature “reflation.” My own sense is that any collateral and netting issues would be at the top of any list of explanations for these difficulties (as well as some of the reasons for what’s gone on in bills and repo, meaning competition for collateral). This is one drawback for the data being a quarter behind given that cross currency basis swaps are once more suggesting global “dollar” tightness in real time.
As with the TIC data, though the report is rearward-facing it still provides a useful service in corroborating and even calibrating our assessments. In this case, both “reflation” as well as its difficulties and systemic short-comings are evident in the derivatives details. Banks were largely onboard with a small rebound in Q4 2016 and Q1 2017. The more cautious tone of activity starting in Q2 matches the first inflection away from “reflation” found in various prices and even economic data (as a result of, or even in anticipation of, relative tightening).
Stay In Touch