
The Treasury International Capital (TIC) report produced somewhat of an anomaly in its update for August 2017. There was a lot going on during that month, mostly as UST yields fell (even though interest rates have nowhere to go but up, supposedly) while CNY continued its blistering ascent. As to the latter, it was quite clear by then Chinese actions related to the exchange rate were being routed through Hong Kong.
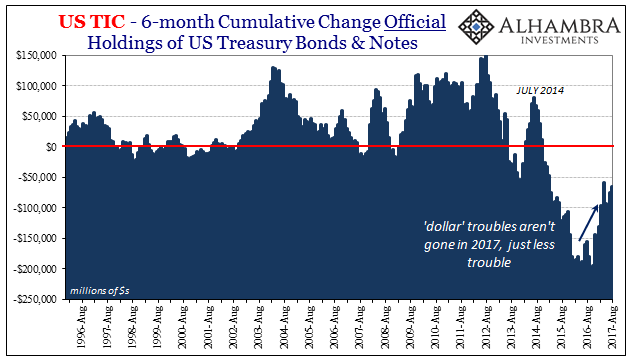
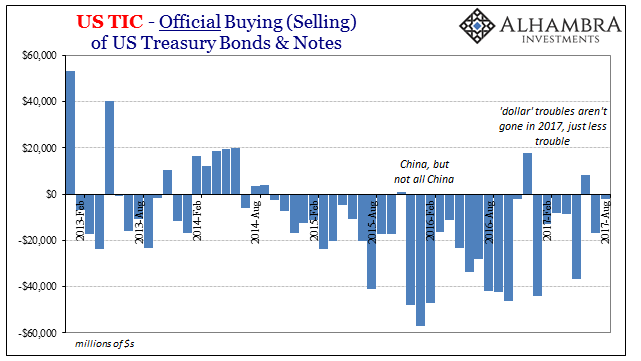
Before getting to Hong Kong, though, a review of the basics of the TIC report were entirely familiar. Central banks and foreign official entities continued to sell UST’s, on net, though by a small amount in August. It again suggests to us the difference between this year and last year is not a eurodollar system on the rise but one less of a problem more directly. There’s still a worldwide “dollar” obstruction, just faded a bit from the front burner.
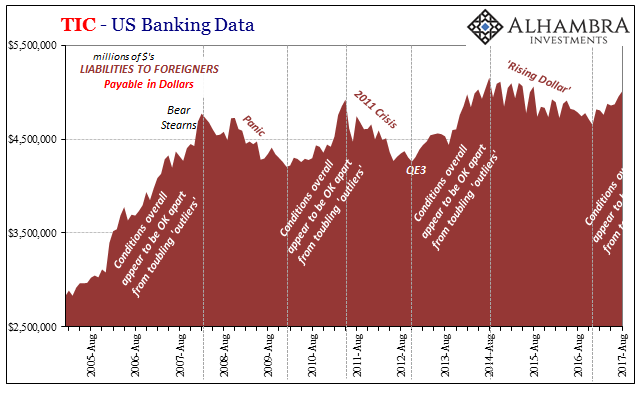
The issue, as always, is bank balance sheet capacity. The TIC series up until a few months ago was rather clear in its various estimates for how that was evolving. There are several data series underlying that don’t always add up to the same possible situation month to month. Updated figures suggest one of those times here.
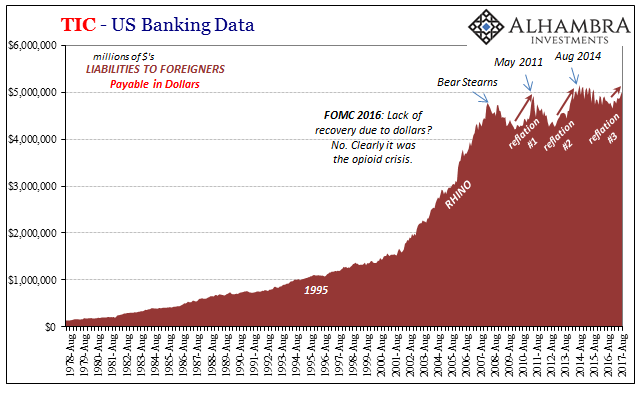
In the monthly flow series, the top level data for bank liabilities denominated in dollars showed a sharp increase for August. It was for a middle month in a quarter the largest increase since Q2 2013(May).
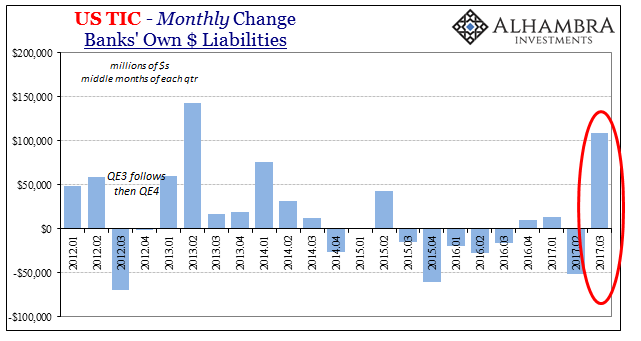
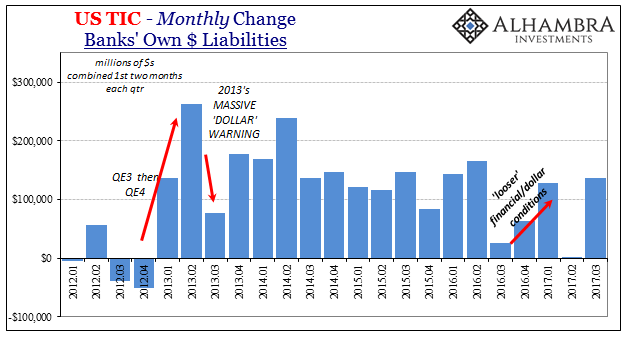
That followed a very weak opening month for Q3 2017 (July), so it isn’t clear what really happened June to July; or even if anything happened at all. Combined, the two months are pretty much in line with the more regular behavior for liabilities changes dating back to 2013. It may simply be that banks have altered their intra-quarterly operations, de-emphasizing the huge shifts gathered around quarter-end window dressing that marked the past few years.
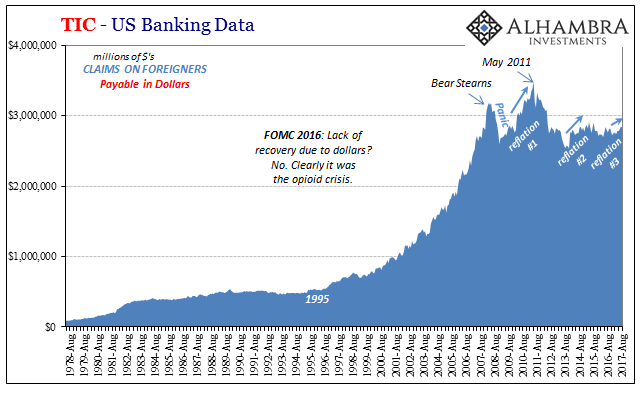
If we go searching for an August jump in bank liabilities elsewhere, we don’t find one. It’s not a requirement that we do, meaning that these flow level figures are not derived from the same source as the balance level estimates. Taking the latter by geographical breakdown, we find instead mostly the same trends in each of the various jurisdictions.
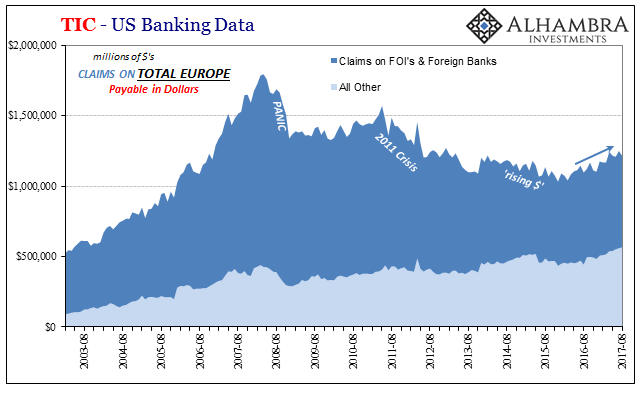
In Europe, US banks continue adding to their dollar balance claims (lending in dollars to whomever in Europe). The trend also avoids European banks as counterparties for those claims in favor of non-bank entities (the ubiquitous “all other”).
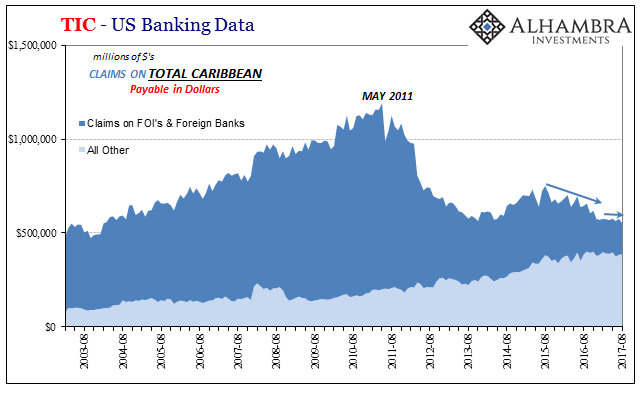
In the Caribbean, banks in the Caymans as well as other (literally) offshore havens remain reluctant to restart their “dollar” undertakings. Their transactions from onshore aren’t declining as they were during the “rising dollar”, but they also aren’t growing, either. It’s a rather good example of “reflation” in this third iteration and its comparatively reduced stature.
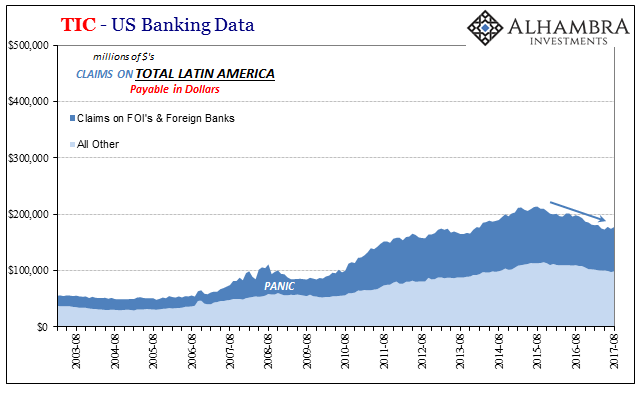
The same pattern is also observed in Latin America.
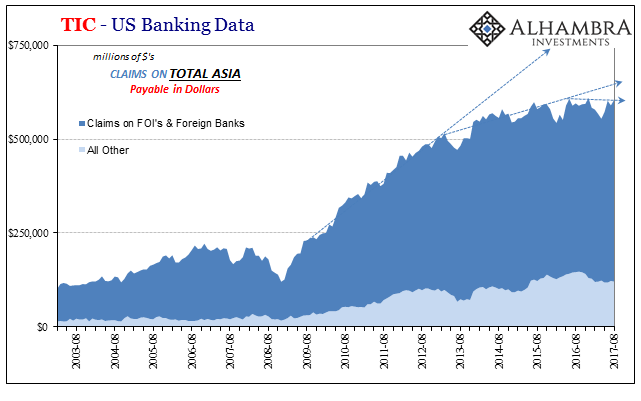
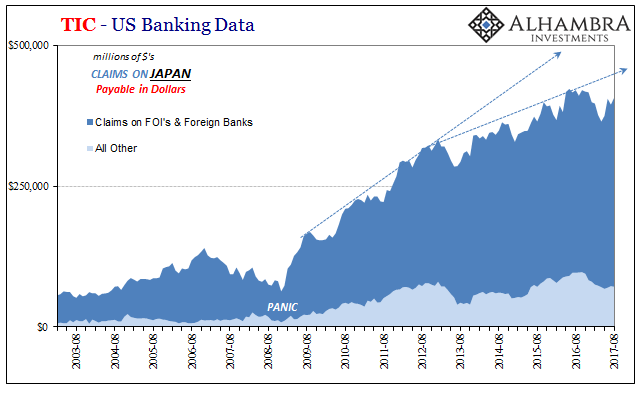
The other major geographic eurodollar segment, Asia, goes on where the gently rounding top softens again for another month. Both Japan as well as non-Japan Asia are no longer transacting at a rate like they did from 2009 to around 2013 or 2014. In fact, because of a reduction last year in Japanese counter-transactions in “dollars”, the total outstanding balances with Asia are down slightly from mid-2016.
The only major eurodollar center experiencing a robust turnaround is the often forgotten offshore money center of Canada. US banks increased their business with Canadian banks rather sharply since April, up about $36 billion or 24% in just few months. That is also in parallel with US banks’ customers increasing their dollar activities in Canada with and without Canadian bank counterparties (not shown below; customer level data is released on a quarterly basis).
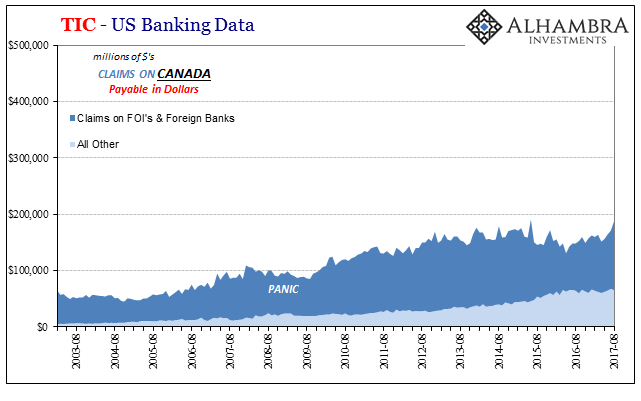
Even with that gain, however, Canadian interbank balances are merely back to where they were in the first half of 2014.
In total, then, August was rather nondescript from the perspective of bank balances moving “dollars” in and out of the United States. It isn’t clear that the flow level data for the one month is really meaningful, as these other series remain related to the unremarkable “reflation”#3 trend.
I think that’s why we are left to ponder possible redistribution effects rather than more general changes at the top levels. That means looking more closely at China and Hong Kong.
Stay In Touch