In later 2014, the Bank of Russia began to repo out eurodollars to local Russian banks. These financial institutions were being increasingly deprived of “dollar” funding on global markets. It made sense that Russia’s central bank would step in on their behalf, redistributing what it could out of its own pocket (though exactly which one was never made clear) to avoid a worst case scenario. Still, it got pretty bad for Russia anyway.
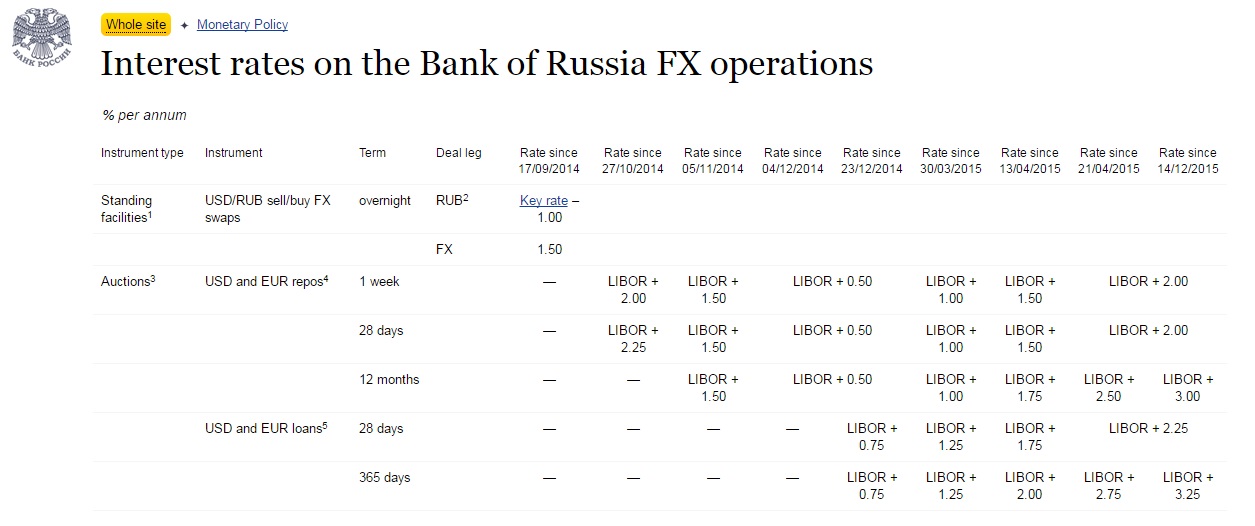
The ruble crisis that erupted at the end of 2014 was intense, offering Russian officials several shaky weeks where they didn’t how, exactly, they might stumble their way through it. On December 11 of that year, the benchmark money “key rate” was raised from 9.5% to 10.5% to address the rubles plunge. A mere four days later, the Bank of Russian raised it to 17%. It didn’t really do all that much, unsurprisingly, the currency’s plunge keeping up for more than a year after.
But that’s all in the past now. Russia’s brush with the “rising dollar” caused a lot of economic damage there just as it had elsewhere around the EM’s, but the ruble registered its lowest point on January 21, 2016, and has been rebounding since. Their monetary problems are over, right?
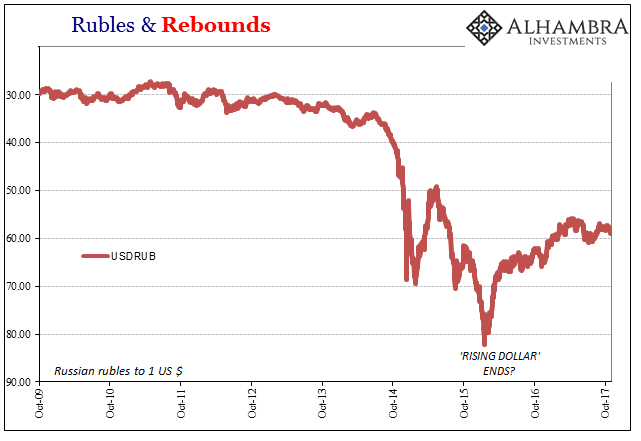
Maybe not. The ruble has only made its way back to 55 to the dollar, well short of the exchange rate of 30 prevailing before the eventful summer of 2013. Worse than that, it has been moving lower again going all the way back to April 2017, seven months of a gentle if unmistakable slump that raises several issues.
One of them is oil. Russia’s economy has really been stripped of growth capacity apart from its energy sector. Therefore, the whole system is quite susceptible to oil price changes, and the chart above both up and down looks suspiciously like the chart for WTI – especially the “rising dollar” part.
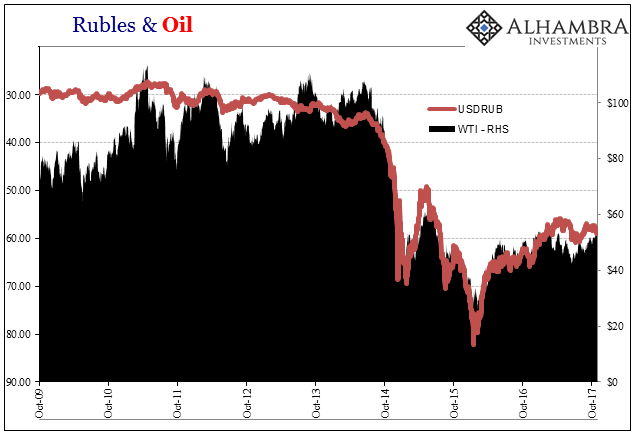
Except, as noted last week, oil prices have risen vigorously over the past several months while rubles have not. The divergence here along with the one noted for US junk (leveraged loans) is curious, if not downright indicative.
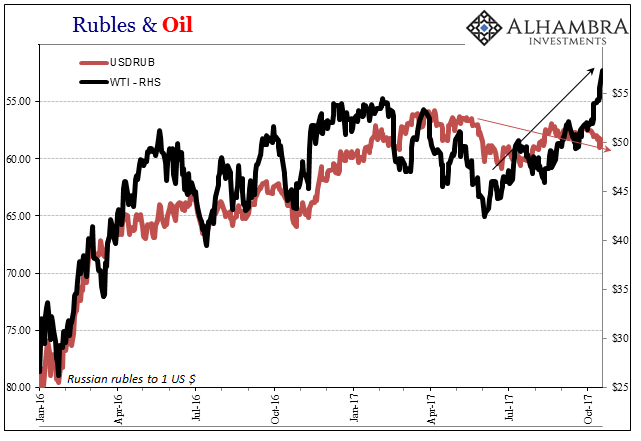
Though we can tie Russia to oil and oil to rubles, there is more to it than that; starting with the lack of more complete rebound in oil (thus rubles).
The difference is surely reflation, or really “reflation.” The US Treasury market isn’t the only one that isn’t buying the synchronized global growth scenario. No matter how many times the mantra is repeated especially in light of what the Fed is doing, actions, trading actions, speak louder than words. This Reflation #3 was always short to begin with, a relatively unappealing comparison that should have given the usual suspects in the media great pause before giving out their unflinching optimistic assessments.
These warnings are never really considered because for Economists and policymakers even after ten years there is this economy that “should be”; but never is.
I wrote last December, at what is proving to be the apex of that last “reflation”, there was importantly a lot missing from it:
This latest market, by contrast, comes up seriously short in all those respects. Not only has the entire UST curve shrunk due to the monetary eurodollar tightening under the “rising dollar”, even in this latest selloff nominal yields are rising but the curve isn’t steepening let alone exploding. The further out you go, where the real economy is far more of a factor, the less vibrancy is indicated as to what might be beyond the short run. The 5s10s, perhaps the most important part of the yield curve overall, isn’t any steeper today than it was to start the year amidst obvious global financial, economic, and monetary turmoil.
What these prices and currencies are suggesting in their avoiding the full return trip back to health is that the “rising dollar” was no transitory disruption. It’s indicative of what we find time and again, that whatever economy or financial system unfortunate enough to be hit with the eurodollar’s more immediate wrath is left worse off for the (grave) trouble.
It’s not just Russia and oil, either. There are, again, any number of ways that all independently still add up to this scenario. It might even propose that the “rising dollar” itself never really ended (see: China, Hong Kong).
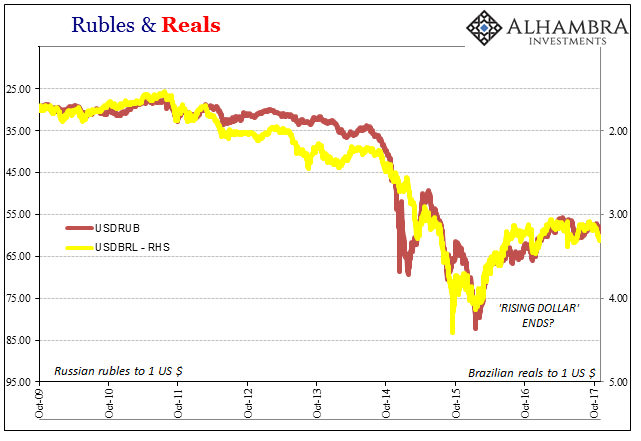
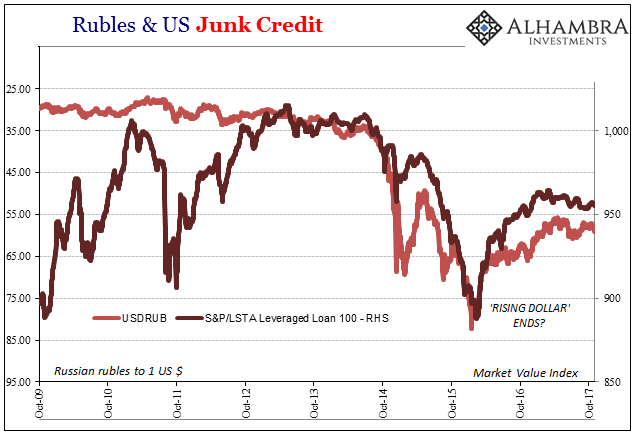
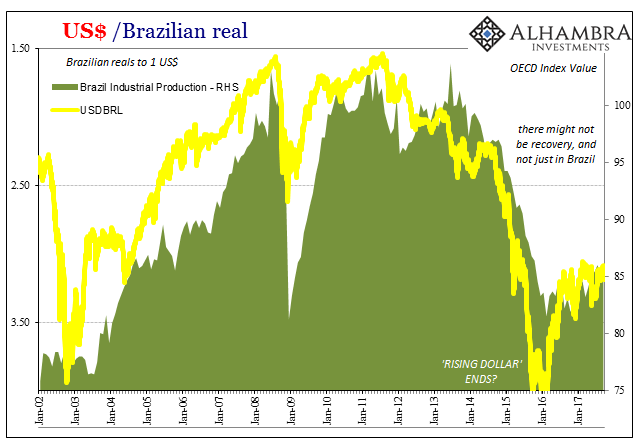
For me, it all gets back to eurodollars (no surprise). As much as it may seem in some instances that things are better this year, that’s only a relative comparison to when things were really bad last year and the year before. Less bad does not leave the world with good, the very mistake that keeps being made over and over. All these charts, above and below, can be described in exactly those terms.
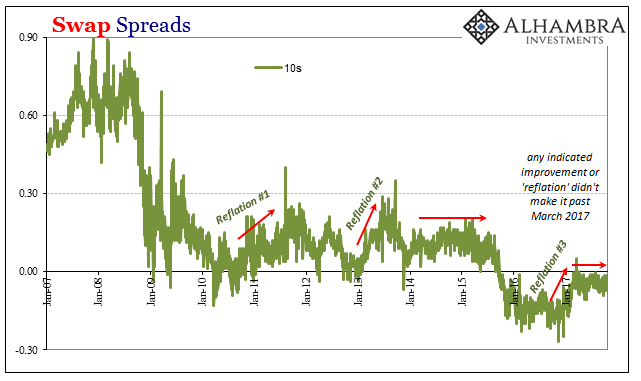
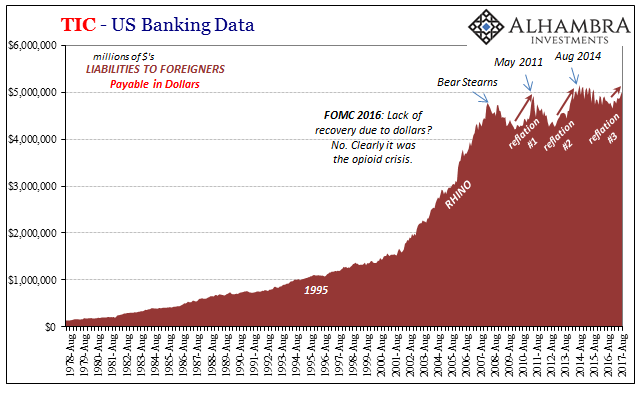
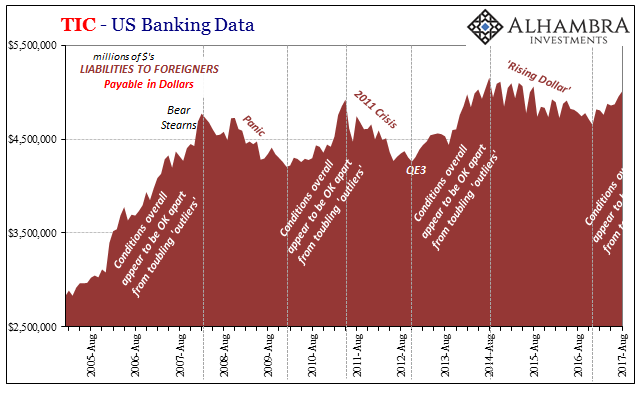
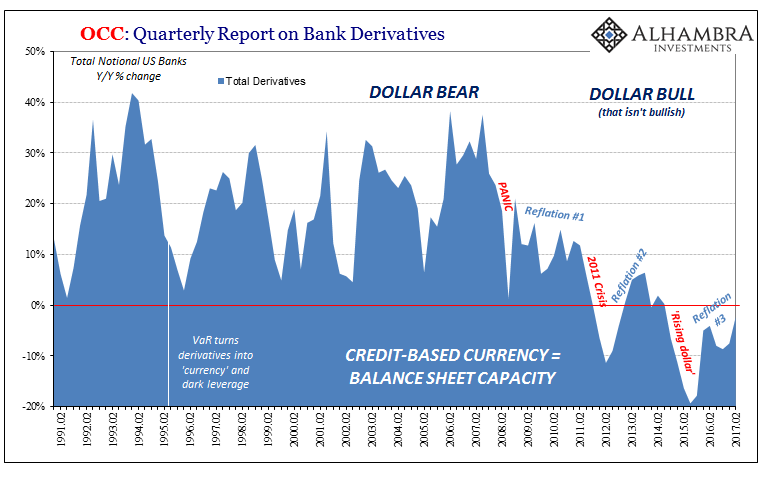
The relatively small degree of positive correction in Russia, oil, Brazil, China, etc., are all consistent with the relatively small degree of “reflation” found across eurodollar terms. Closing in on two years since the worst of the “rising dollar”, it’s pretty clear this is as good as it gets, which, again, is nowhere near good.
These markets are merely pricing risks based on that more realistic assessment where some serious (permanent?) capacity damage is easily apparent, though monetary injury that Western central bankers still haven’t the slightest idea about. It is how one lost decade becomes two.

Stay In Touch