
The August appearance of Hurricane Harvey has made economic analysis a little more challenging than usual. That it was followed closely by Hurricane Irma only compounded the difficulty. What we have observed, however, is pretty much what we expected. In several economic categories and among various statistics, there was a rush of activity in October that in most places continued into November.
One of the sectors that has been exhibiting this behavior is housing construction. Permits and starts were both up sharply in October, while only starts continued higher in November (all seasonally-adjusted). In December 2017, updated figures released yesterday, the estimated level of permits declined slightly (within the margin of error) suggesting that filings for new projects stalled after October. The level of starts, however, fell sharply in December, back just about to where it was before either storm landed.
That’s ultimately what we are after; looking for confirmation one way or the other. Was the October/November burst an actual inflection, a breakout in the economy far more consistent with current rhetoric (especially as people look at the most recent BOND ROUT!!! that way)? Or, as we have suspected, was all that just the anticipated skew these kinds of large weather disruptions have produced consistently in the past?
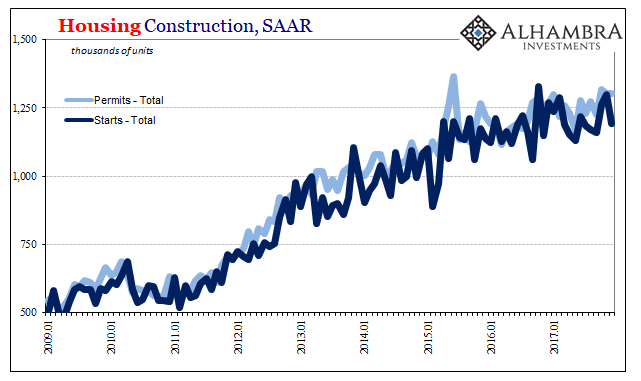
Despite the near euphoria expressed in the mainstream about those two months in particular, as you can plainly see above, there really isn’t much to suggest a breakout of any kind. Starts, having dropped back, may be suggesting again lower levels of construction that were being indicated before the tropical breakout toward autumn.
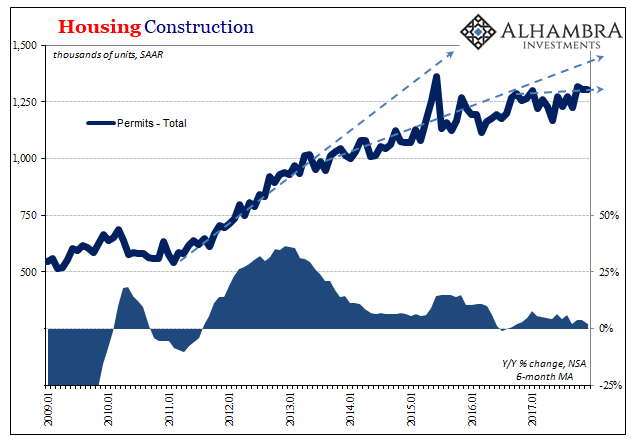
And that includes what for December was some unexplained seasonal adjustments that in the SAAR estimates put them above where they might otherwise have come out given the unadjusted data. Total housing permits, for example, were basically flat with November 2017 seasonally-adjusted despite being down 2% year-over-year unadjusted.
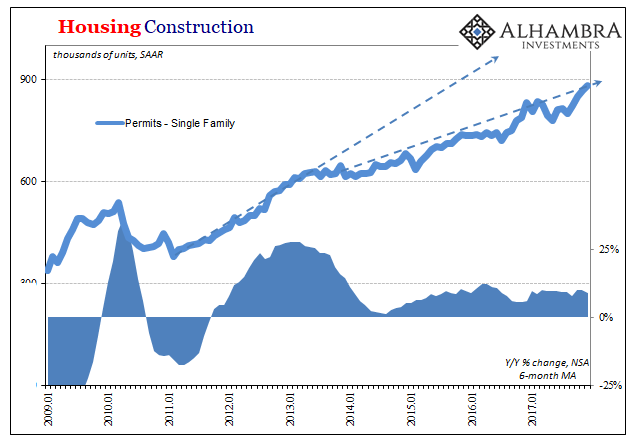
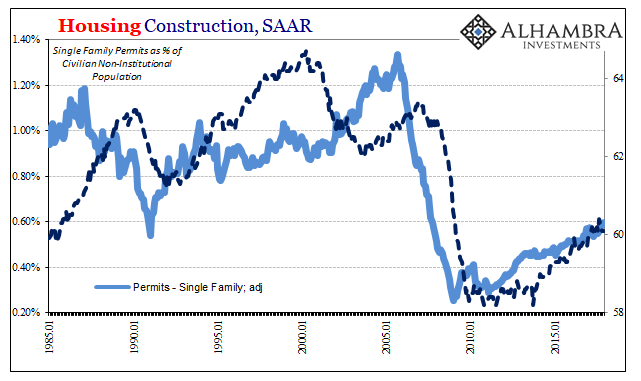
That difference is attributable to a divergence in single family permits. Unadjusted, total permits in this segment were up just 1.8% year-over-year, but in SAAR terms they rose again to a new cycle high just shy of 900k. At that level, seasonally-adjusted permits are instead more than 6% above the SAAR estimate for December 2016.
These construction numbers do tend to be noisy and volatile month to month, so I would expect that next month or the month after this difference will be brought back in the other direction, ultimately evening out unfortunately on the downside.
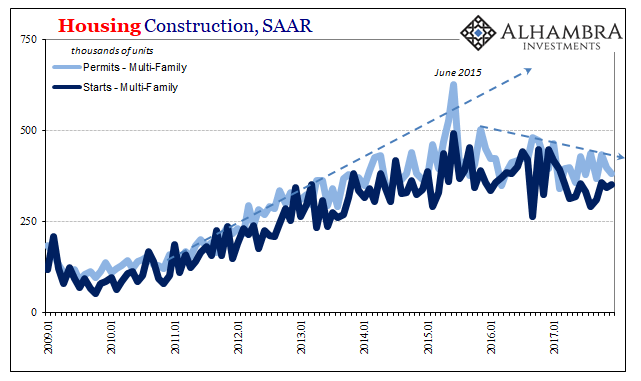
As has been the case for almost three years now, the problem is that this lower level growth in single family construction is unable to offset outright and accelerating contraction in the multi-family segment. Though the former is a much greater proportion of the whole, the latter’s downward trajectory is steep enough to bring construction growth overall to a full stop; one that goes all the way back to the summer of 2016 (when the labor market slowdown really started to hit).
Unadjusted, multi-family permits declined 7% year-over-year in December, the 6-month average now -8.8%. Multi-family starts dropped by 21.6% last month, after rising 4% year-over-year in November and breaking out, for one month anyway, of that lower trend. The difference in degree of contraction has left permits to be significantly higher than starts, which either reflects some expectation of a small rebound in early 2018, or, more likely in my view, given that permits are falling, too, builders keeping some options open while ultimately failing to exercise them (after being disappointed by macro factors, such as actual customers) with shovels in the ground.
Also, as usual, we have to put these estimates in context, meaning that though we will continue hearing “the highest since 2007” for single family permits especially it doesn’t really mean all that much. The construction industry for housing at least continues on in a heavily constrained state overall, shrunken just like the US economy as a whole. There is less proportional building simply because there is less proportional working. No amount of QE, even targeted at MBS, had been able to address this large shortfall.
We may, in fact, be seeing the countertrend of too much building in 2012-13, particularly in multi-family, anticipating at the time QE would work.
In other words, even if the larger increases in permits and starts during October and November had represented macro rather than non-macro factors (in all likelihood), it still wouldn’t have amounted to all that much in the grand scheme of this economy.
Instead, its what this housing data suggests about the overall pattern more recently, and the probable reasons for it (temporary hurricane boost), that is important especially if what we are seeing in housing in December is repeated for other economic sectors and in other unrelated economic statistics.
Stay In Touch