
The current state of geological science cannot predict an earthquake. There is hope, however, that warnings might be realistically developed so that populations in danger of the “big one” can be given some sort of reasonable information about probabilities. In studying the past few devastating quakes, such as the 2011 9.0 that hit Japan twice (once in the shaking, then the epic tsunami) and the 8.2 in April 2014 in the ocean off Chile, scientists were able to record significant data.
Each of those massive seismic events was preceded by foreshocks that were, or we hope they are, distinguishable from other types of instability. Up to this point, earthquake prediction has been totally hit and miss, often left to using precursors like profound changes in animal behavior or the unusual release of gases from the area in question. Now, it is these distinct earthquake swarms, or what some in the discipline are calling the long precursory phase:
We find that there is a remarkable contrast between the foreshock sequences of interplate compared with intraplate earthquakes. Most large earthquakes at plate interfaces in the North Pacific were preceded by accelerating seismic activity in the months to days leading up to the mainshock.
It makes intuitive sense, though in practical use much harder to define. A large earthquake is not a single event; it is a series of shifts and changes that build up to a devastating final act (and then the main quake is not always the last to register). There is a process at work, one that humans don’t fully understand and find great difficulty in measuring and distinguishing.
Financial markets aren’t really much different. Though people have been staring at trading screens for days on end for decades now, and long before that glued steadfastly to the ticker, how much do we really know about markets? Surprisingly little, a condition that may have actually worsened over the past few decades of “don’t fight the Fed” and the explosion in the number of Ivy League mathematicians in every trading house.
Market crashes or panics can be thought of as like a big earthquake, and not just because that’s what it feels like for many. The old joke of 401k’s becoming 201k’s wasn’t really funny at the time, and in late 2008 and early 2009 people all over the world were devastated by the crash.
Listening to Economists on TV, and especially central bankers like Ben Bernanke, you were left with the impression that the Panic of 2008 was totally unexpected; a bolt of destructive lightning from out of the blue. That was patently false, and many like Bernanke knew it. There were warning signs all over the place, minor tremors evident for more than a year and a half that “something” bad was building.
Stocks experienced yesterday a liquidation event. We perhaps forget that even the panic in early October 2008 wasn’t a traditional type crash. In 1929, for example, stocks were down huge in single day sessions. In 2008, circuit breakers by and large worked as intended, only they didn’t stop the crash they instead spread it out over a little more than two weeks. There was no Black Whateverday, just a slow motion train wreck unavoidable once it got started.
The single largest down day during that period was 9% (S&P 500) on October 15, 2008. That bad day was preceded two days before by one of the largest gains in American history, +11.6% on October 13. From the Friday before Lehman to the day before Citi was bailed out in November (a day later swap spreads turned negative), the S&P 500 lost just about 40% but it was no straight line down (though the more time passes, the more it looks that way to history).
These modern liquidations were not limited to just late 2008 and full-blown panic. There was another in late July/early August 2011 following largely the same disjointed pattern. On July 22, the S&P was 1345 and by August 10 nineteen days later it had shed 16.8%. The biggest down day was -6.7%, and the market was flat or up in five sessions.
Unexpected to many, there were again warnings beforehand (not surprisingly, during an emergency conference call during that sharp stock selloff the FOMC debated bailing out the repo market).
The market selloff over the last week reminded me more of October 2014 than anything. Like these others, the “rising dollar” was a long and arduous strain of illiquidity though focused that time more globally. Not that the Panic of 2008 was limited in geography; it wasn’t. The 2014-16 period was more intense in the offshore outlets directed toward the EM’s and China, only breaking into the American consciousness at specific points.
One of those was October 15, 2014. That day will forever be known for what happened in the UST market, a buying panic (collateral run), but we shouldn’t forget that stocks were drawn into it, too, before that day. After enjoying a huge run in 2013 and still a robust one in 2014, shares began to stumble a little in late August 2014 and then met with a liquidation in the middle of October.
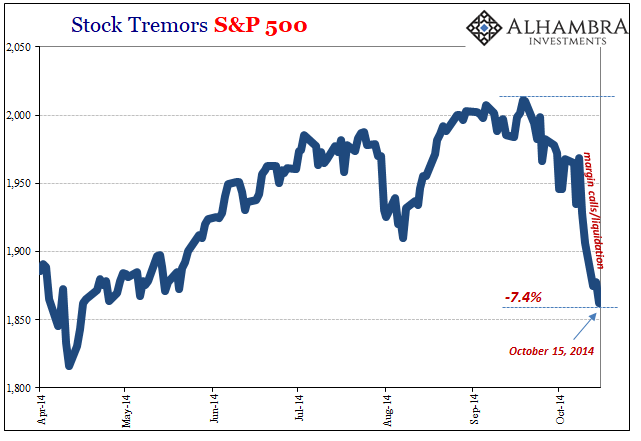
High to low, the S&P 500 shed about 7.4%, most of it concentrated in just three days where the largest decline was 2.1%. It was sufficient to get everyone’s attention, if for only a few brief moments before getting back to the euphoria over QE’s forthcoming successful completion and the expectation for the economy’s rocket-like takeoff in 2015.
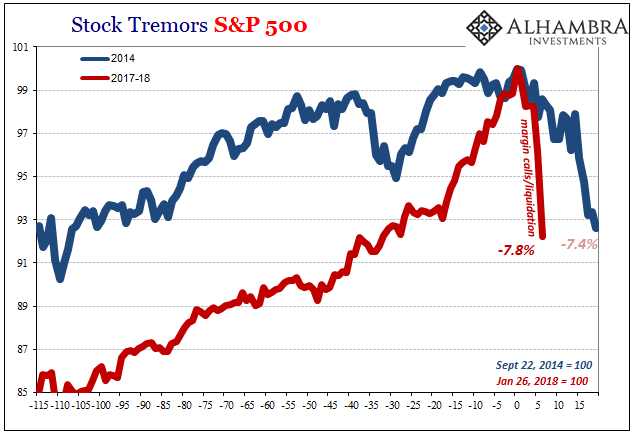
The current stock market run has been far more uniform as well as more intense; hardly experiencing any down days at all, especially since mid-December 2017. But like October 2014, there were warnings that liquidity wasn’t all that great, and that minor tremors emanating from deep within the shadows were being overlooked.
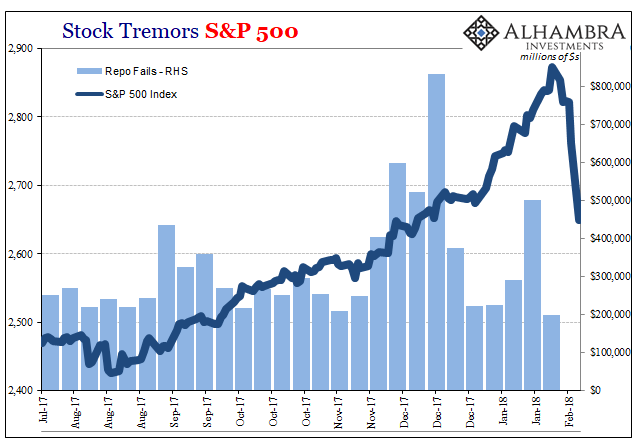
There is no one-to-one relationship, though it seems like there should be. Like geologists searching for the key to unlocking earthquake prediction, and coming up still short of it, we, too, are left with an imperfect understanding of how complex and hidden processes play out. You would think that $800 billion in repo fails in mid-December (along with a blowout in the global negative swap basis, particularly the euro cross) would right then and there destroy the stock market and totally reverse the dollar.
That’s not how these things work. They are processes where the interplay between the various parts we will never completely understand. All we can do is, like earthquake forecasters, take note of the precursory events and appreciate what they are telling us.
To be clear, this doesn’t mean that another 2008 is forming right beneath our metaphorical feet. Like late 2014, that didn’t really happen, either, though for the overseas pieces of the eurodollar system by early 2016 it sure felt that way (especially in economic terms). That’s ultimately what should be our focus, the non-specific idea that not everything is well out there in the shadows no matter how much “reflation” is stuffed into rhetoric and the occasional market price.
After all, what did stocks do starting the day after October 15, 2014, and then for the next five months?
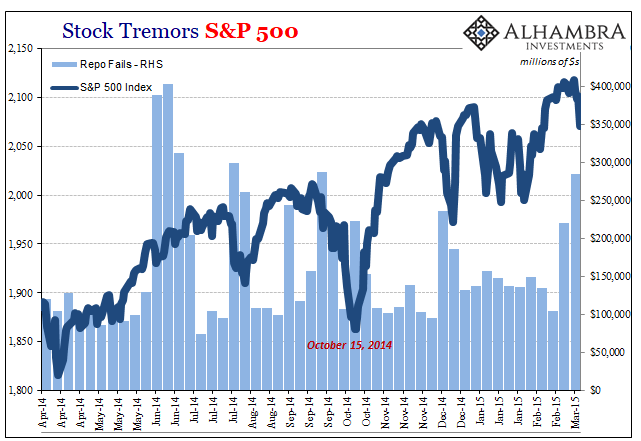
The repo market calmed down and the S&P went on to hit record highs all throughout the spring of 2015 – while illiquidity built up underneath, showing up as often entirely overseas tremors. There was much more volatility to the trend post-October 15, but it was still rising nonetheless.
Again, these things are processes and they take time to play out. We are left to believe that downsides are all short-term events. In the 21st century, they aren’t that way at all. If there is a long precursory phase, they have all tended to be very long.
While they do take their time, things can look so good in general, normal even. But we still have to remember that these markets and the whole global economy are all living right over top the biggest monetary faultline, the eurodollar system, there is. No matter what the Fed says, what it always says, it hasn’t been quiet.
Stay In Touch