
Economic Reports
Economic Growth & Investment
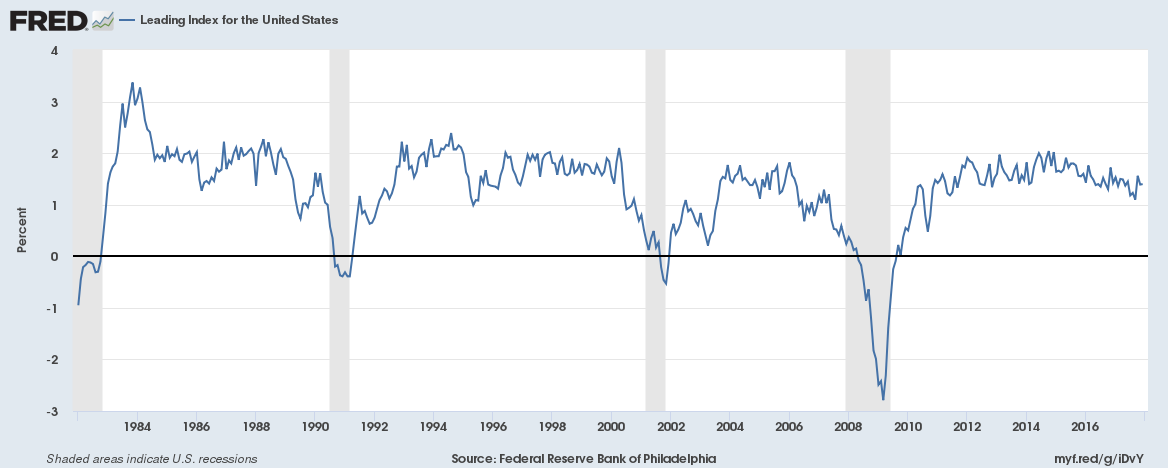
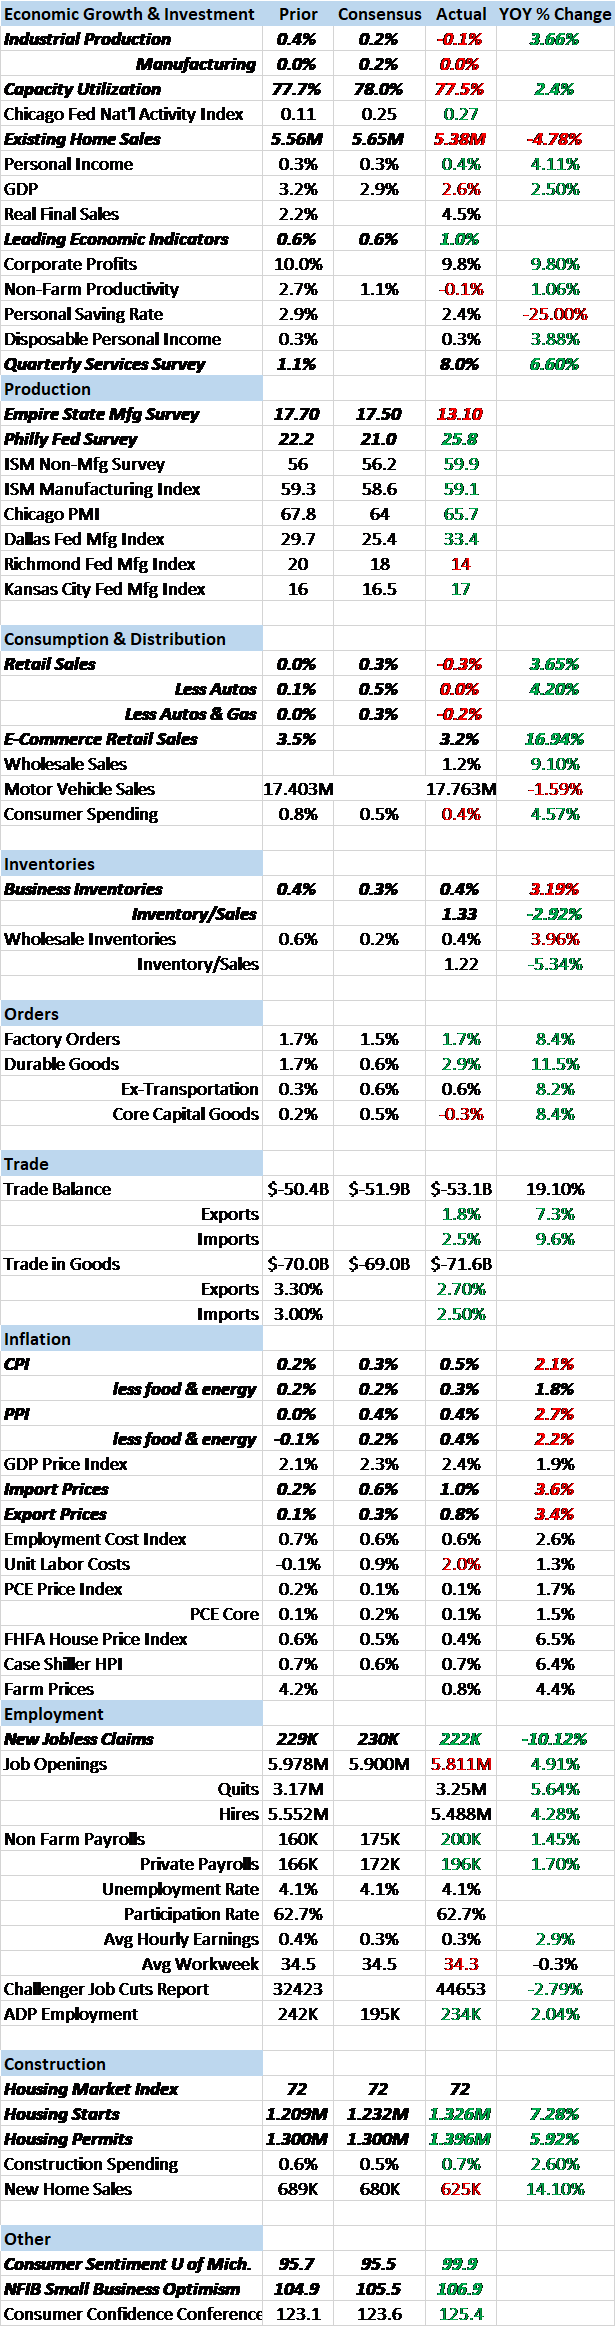
We pay particular attention to broad based indicators of growth. The Chicago Fed National Activity Index and the Conference Board’s Leading Economic Indicators are examples. We watch them because we are mostly interested in identifying inflection points in the broad economy and aren’t as interested in the details. Why? Because, while bear markets do happen outside of recession, it is rare and unpredictable. Our best chance of acting in advance of a bear market is to identify the onset of recession. And concentrating on the details of the economic data can cloud one’s judgment about the overall economy which is what matters to the market as a whole.
But we also think you have to be careful in interpreting these indexes. You don’t want to overreact to noise or not react to a real warning. So it is interesting, in the case of the LEI, to see what factors are moving the index. The most recent release showed a rise of 1% in the LEI, quite a bit stronger than expected. But what drove the rise? Building permits, stock prices and ISM new orders, none of which, by themselves, are very informative about future growth. All of them are, to some degree, measures of sentiment rather than actual hard data about the economy. Building permits are not a commitment to actually build anything even if they do show intent. Stock prices, as the old Wall Street saying goes, have predicted nine of the last five recessions. And the ISM report has been showing robust growth for over a year that quite simply refuses to show up in the hard manufacturing data. So don’t get too excited about the LEI; it isn’t as strong as it appears.
And no, the positive ISM and regional Fed sentiment still hasn’t found its way into the industrial production report, down 0.1% in January with the manufacturing part of the report flat. December was revised down significantly as well. One can’t help but wonder if the Trump administration’s honeymoon period is about over; sentiment works for a while but at some point the growth has to actually show up.
One recent big bright spot was the Quarterly Services survey which showed an 8% rise in information services spending. That’s a huge improvement over last quarter which was up just 1.1%.
Production
The Empire State and Philly Fed surveys were both positive but both also showed rising price pressures. There seems little ability to pass along higher costs to consumers at this point so if costs continue to rise it will likely be reflected in profit margins.
Consumption
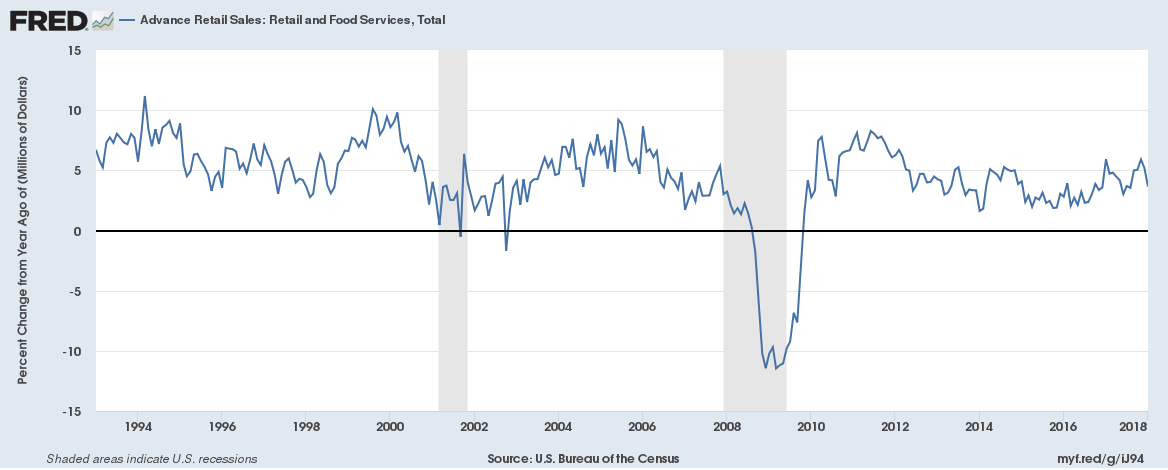
Retail sales disappointed, down 0.3% in January with December revised lower as well. Autos were quite weak likely a reflection of the end of the Hurricane Harvey surge. Building materials were also down 2.4% which also may reflect the end of the hurricane rebuilding. The slowdown also hit e-commerce retail sales but only in the growth rate, down to 3.2% from 3.5% the previous quarter. Year over year growth rate is still near 17% so no reason to panic but online sales may be starting to mature a bit.
Inventories
Businesses continued to build inventories in December, up 0.4% led by manufacturers and wholesale. But with retail sales slowing in January I would not expect to see this trend continue. The inventory/sales ratio was unchanged at 1.33, an elevated level but well off the highs.
Inflation
All the inflation reports of the last two weeks were hotter than expected with import and export prices in particular accelerating. One thing to note is that producer prices are rising faster than consumer prices, an indication that margins are going to take at least part of the hit from rising prices.
Employment
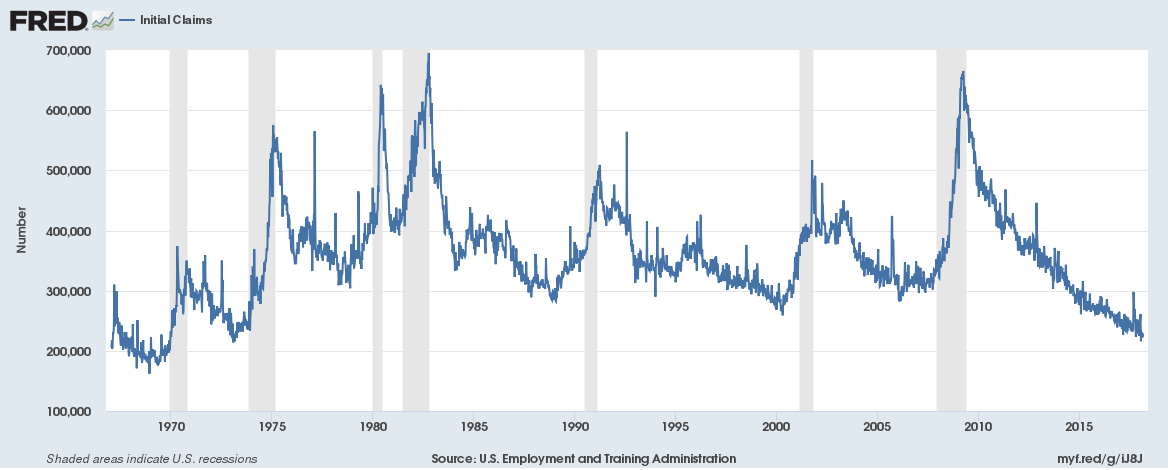
The only employment related data were jobless claims which continue to track at levels (222,000 new claims) not seen since the 1970s when the population was a lot smaller. I have been thinking recently that this may be a structural issue related to the gig economy. So many people today are working as 1099 contractors I wonder if claims will be as useful in the future as an indicator of the economy. Contractors are not employees and if their contract isn’t renewed they can’t file for unemployment. Claims may be permanently lower as a result. I do think they would still rise in recession but maybe not until it is well underway. Companies seem likely to let go of contractors before actual employees.
Construction
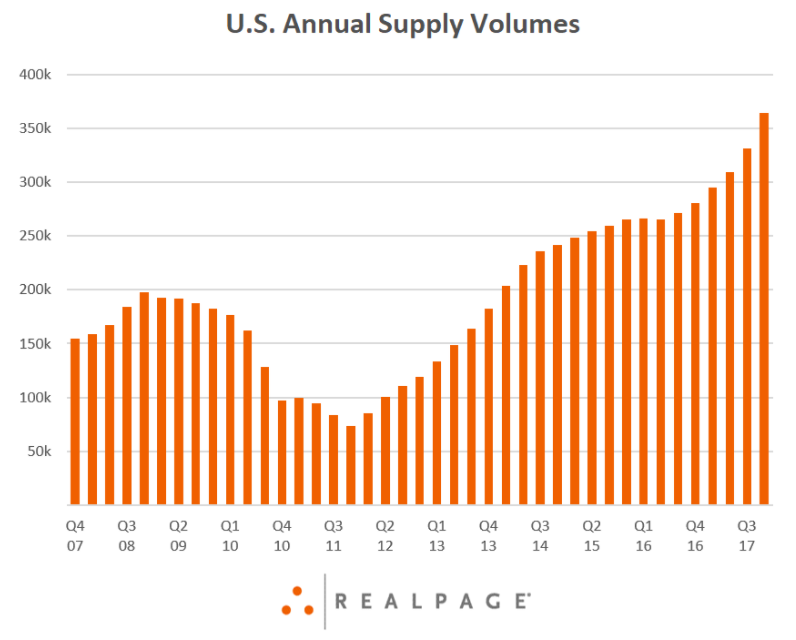
The housing market index continues to show optimism on the part of builders, posting another reading of 72. That’s well above the 50 level that denotes growth. And why not? Housing starts and permits were both up quite nicely on the month with starts up over 7% year over year and permits up nearly 6%. The gains were led by multi-family which is not surprising given the tepid growth of new home sales. Are builders too optimistic? Maybe. Vacancy rates are still pretty low but apartment completions just hit a 30 year high in 2017 so supply is coming on. Rents are rising pretty much in line with inflation so there doesn’t appear to be any shortage nationally. Absent a surge in the working age population – which household formation tracks pretty closely – I don’t see a surge in building.
Sentiment
Sentiment at the consumer level and at small businesses remains at or near cycle highs. “Good time to expand” from the NFIB survey is at an all time high and consumer sentiment, outside of October last year, is at a 14 year high. There is no lack of animal spirits. Demand on the other hand is harder to come by.
Market Indicators
10 Year Treasury Note Yield
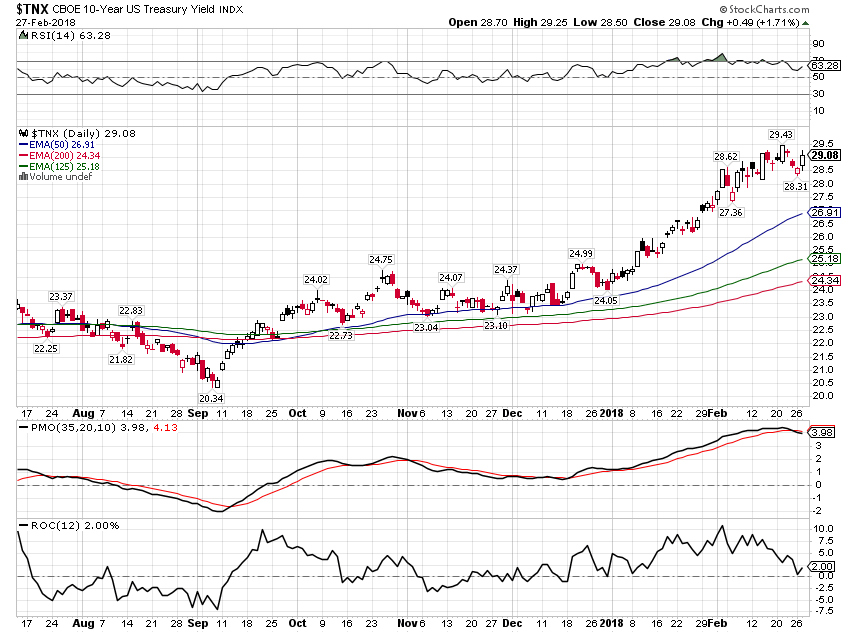
The 10 year yield continued to climb since the last update, peaking near 2.95%, just missing the 3% everyone seems convinced is a foregone conclusion. The yield rose 5 basis points to last Friday and has risen a tad more since. The rise was driven entirely by inflation expectations, not surprising given the data flow over that two week period. Rates are at the high end of the range since 2013. Will it break out? Is the long bond bull market over? That’s sure what the crowd believes and they’ve made their bets accordingly. The futures market shows spec accounts are very short longer term bonds right now. The last time we had a similar imbalance was the beginning of last year and the 10 year yield fell from over 2.6% to 2.03% over the ensuing 9 months. The bond bull market may indeed be over but that doesn’t rule out one last hurrah.
10 Year TIPS Yield
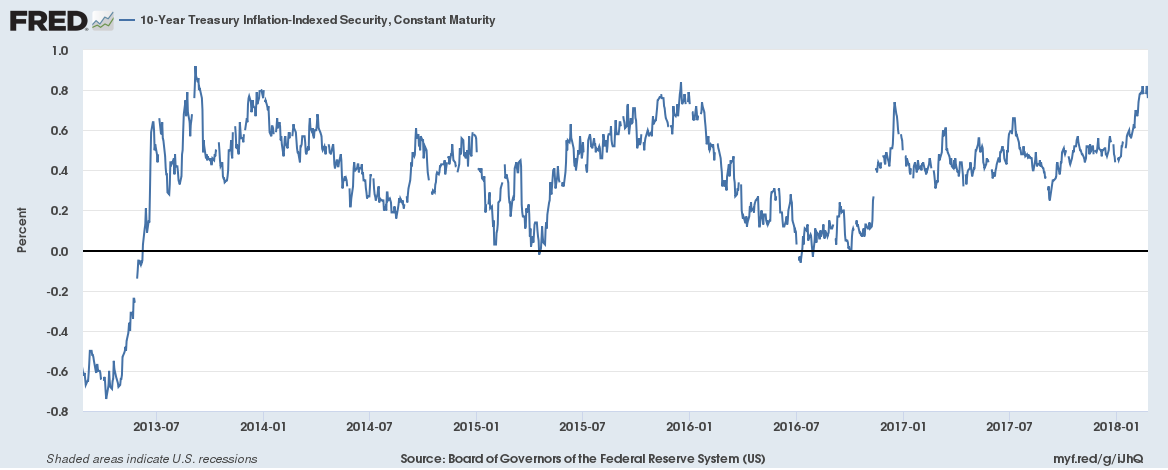
The 10 year TIPS yield fell a couple of basis points since the last update but remains at the top of the range that has prevailed since mid-2013. Until this breaks out, I think we have to assume that growth will stay in its recent range too, likely capped around the 2.5% year over year rate in Q4 2017.
10/2 Yield Curve
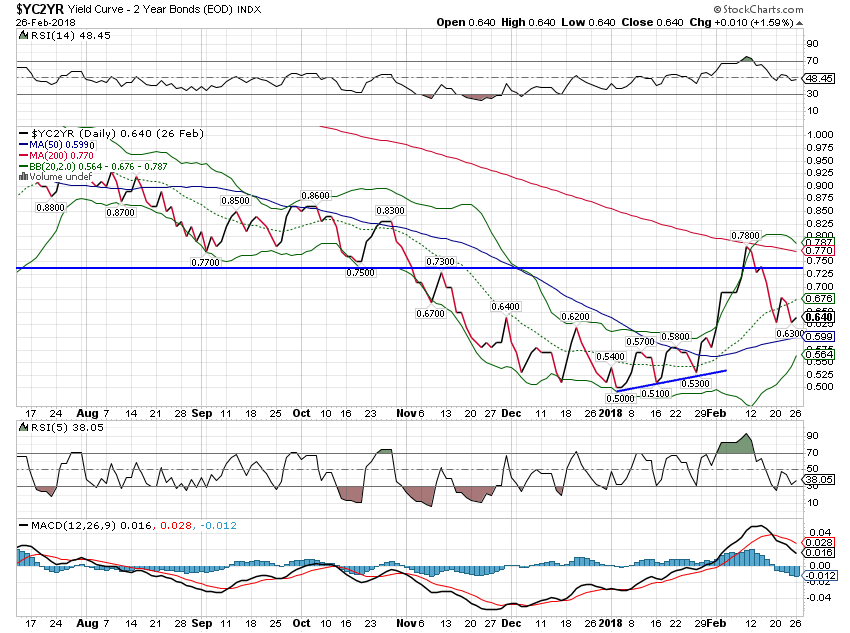
The yield curve flattened by a full 15 basis points since the last update as the 2 year yield resumed its rise after the brief safe haven bid during the stock market correction. It is still above the lows of the cycle but with the new Powell Fed initially appearing fairly hawkish I don’t think that will last. Greenspan’s conundrum is alive and well.
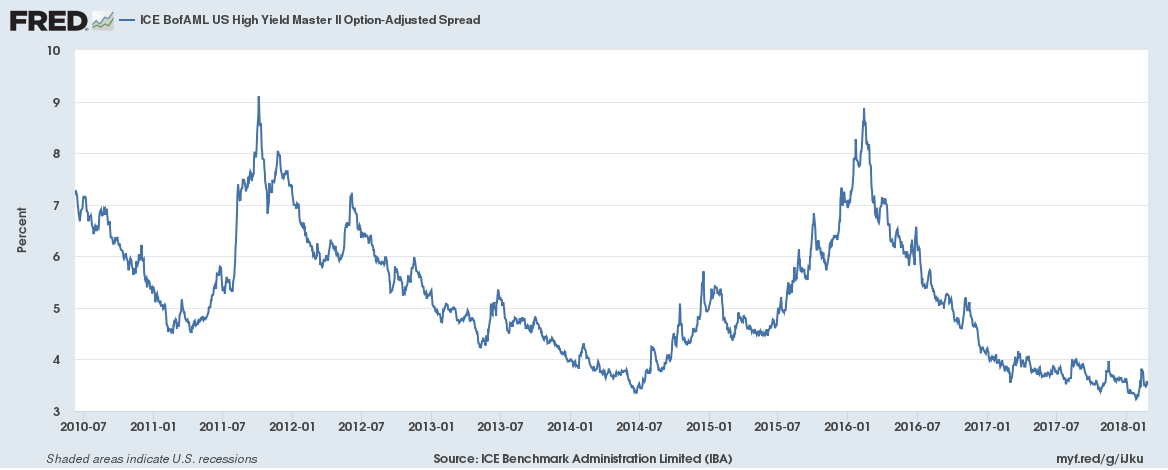
Credit Spreads
Credit spreads narrowed by 24 basis points since the last update as risk appetite returned not just to stocks but junk bonds as well. There are plenty of warning signs in the junk market – underwriting standards are not exactly stringent right now – but credit spreads show a continued willingness to take on risk. As long as that is true expect companies to take advantage of it and issue more bonds. There was a lull during the correction but you might well see a rush here as companies take advantage of tighter spreads while they last.
US Dollar
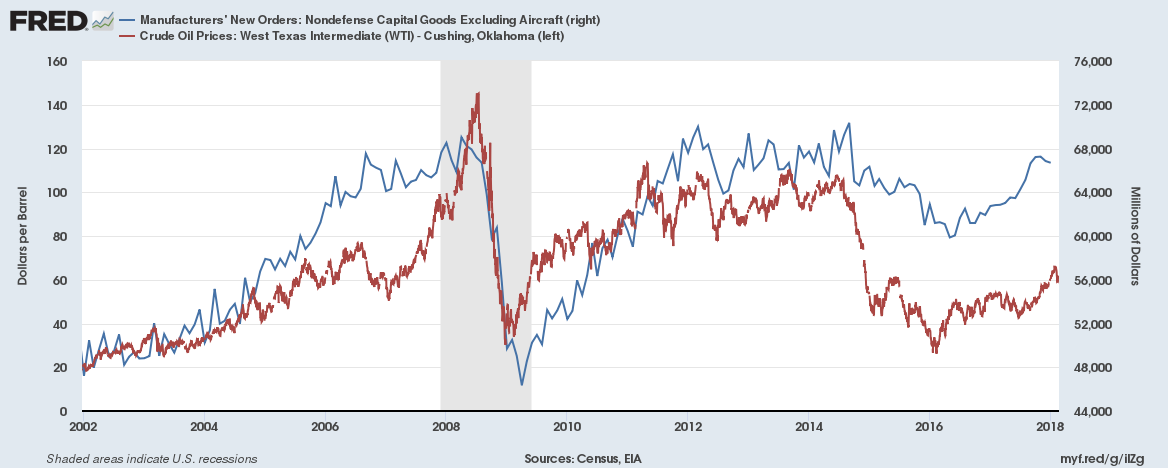
The dollar continues to follow the yield curve lower, although the change since the last update was minimal. Still, with speculative accounts very, very long the Euro, I continue to expect a bit of strengthening in coming weeks. I don’t think the trend will change but a rally back into the low 90s seems highly likely. That will impact markets in a variety of ways but most critically maybe in the price of oil. Commodities generally have a negative correlation to the dollar and oil is quite sensitive to its movements. That may have knock on effects for economic growth as shale investment has led the recovery in capex spending over the last 18 months. Indeed, the US economy is more dependent on high oil prices than it has ever been.
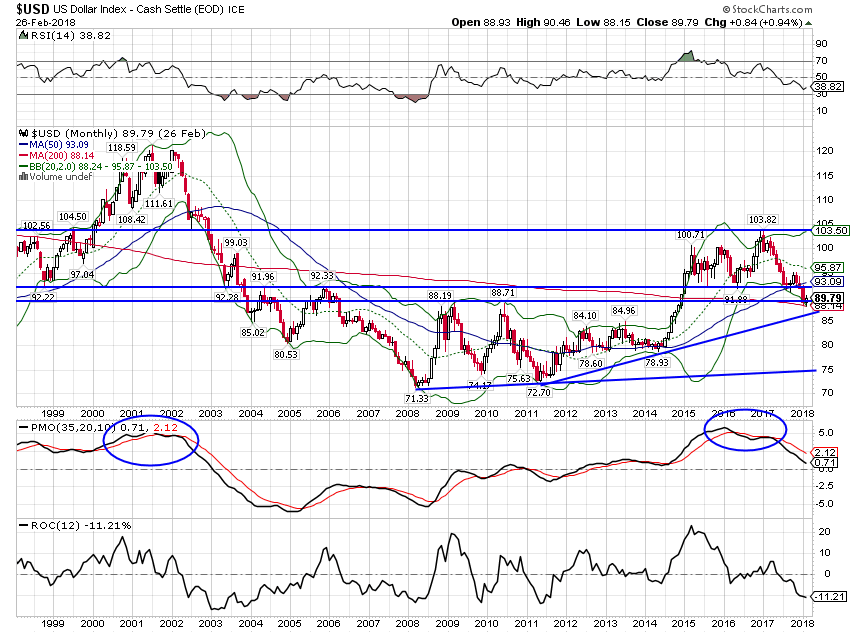
Economic inflection points are almost always a function of changes in investment and our economy has become overly dependent on energy investment for growth.
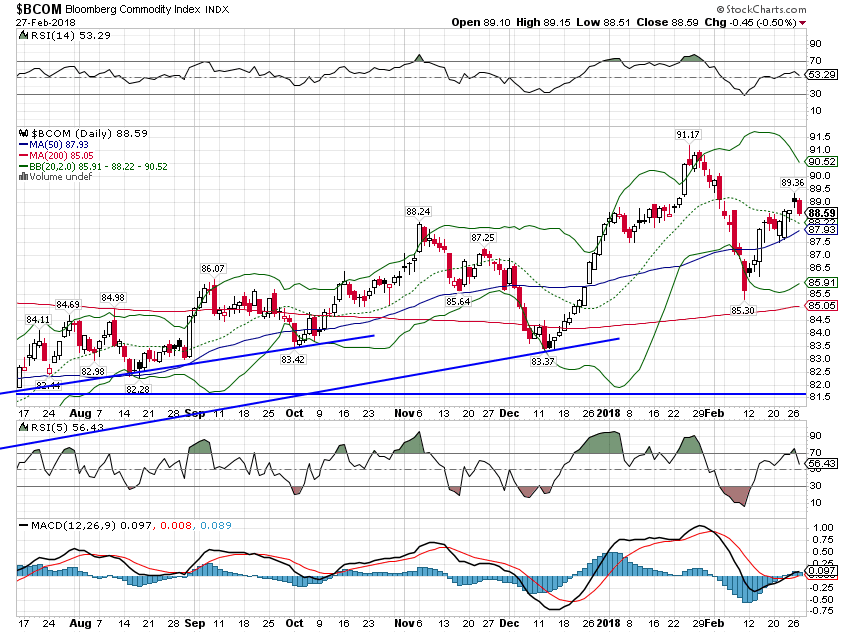
Commodities
Gold rallied as the dollar resumed its fall but some recent strength has pulled it all the way back down to where it was for the last update.
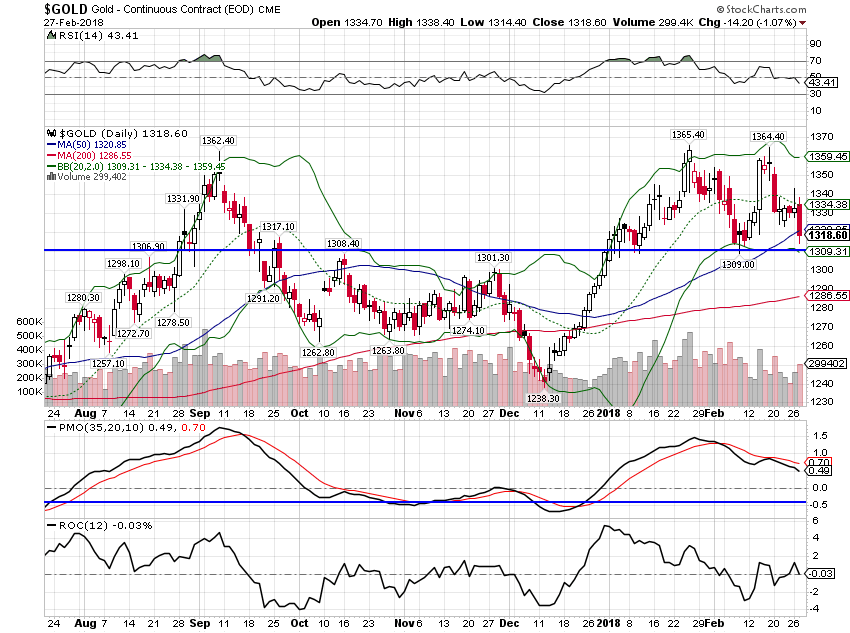
Commodities more generally continued to rise.
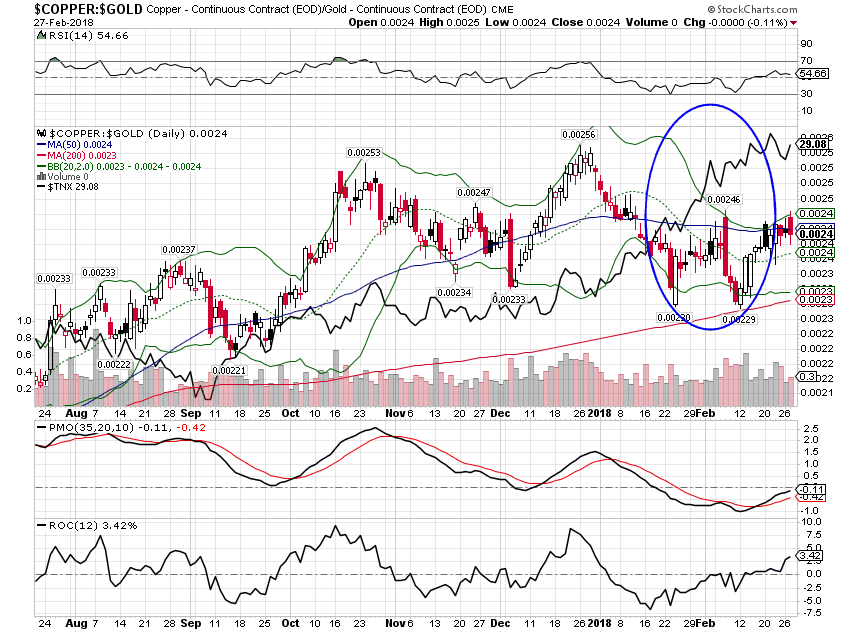
The rise in commodities pulled the copper/gold ratio higher as well, an indication that growth expectations, while not rising, aren’t falling either.
Stocks have recovered about half of the losses from the early month correction. That is actually a pretty classic recovery pattern and doesn’t mean the all clear has been sounded; a test of the lows should be expected. The remarkable thing about both the correction and the recovery is that both happened without much in the way of fundamental change. Yes, growth and inflation expectations have risen slightly but both are within the range of what we’ve seen recently. So are the market indicators we track. The 10 year yield is back near the peak in late 2013 but it hasn’t broken out. Neither have real yields (TIPS). The yield curve had a brief flirtation with a steepening but that seems to be fading quickly and resuming the flattening that would be expected at this point in the business cycle. In short, I don’t see where the big picture has changed all that much. We are still in the new normal just at the top end of that growth range rather than the bottom.
Could things change for the better? Sure, but betting on higher inflation and/or growth right now is the consensus, comfortable trade. The recent stock market correction cleared out only one of several crowded trades – the short volatility bet. There are 3 other very crowded positions that still need correcting in my opinion: short bonds, long Euros and long crude oil. A sharp dollar rally – which almost no one is expecting right now – would do the trick for all three I think. What will be the trigger? The most likely seems a weakening of growth expectations, both here and in Europe. Seems unlikely right now I know but we don’t see positioning like this very often, with speculators all on one side of the market – or in this case three markets. And situations like this always get reversed and usually not gently. The recent rise in volatility seems unlikely to be contained within the equity markets.
Stay In Touch