
New orders for durable goods, excluding transportation industries, rose 9.1% year-over-year (NSA) in January 2018. Shipments of the same were up 8.8%. These rates are in line with the acceleration that began in October 2017 coincident to the aftermath of hurricanes Harvey and Irma. In that way, they are somewhat misleading.
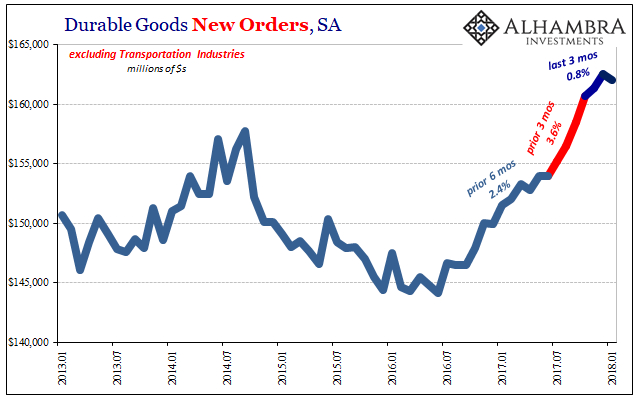
The seasonally-adjusted data gives a better sense of the distortions created by those storms. New orders for durable goods on a monthly basis fell in January 2018 from December 2017. Over the past three months going back to October, new orders have increased by less than 1%.
That’s in sharp contrast to the three month-period before that one. In that quarter-year, durable goods orders were up a robust 3.6%, which works out to annual rate of 15%. Now, that would be a boom. But in the six months before then, orders were up just 2.4%. That means the last three months and those prior six months were far more consistent with each other. It’s those three months coincident to the storms that are way out of line.
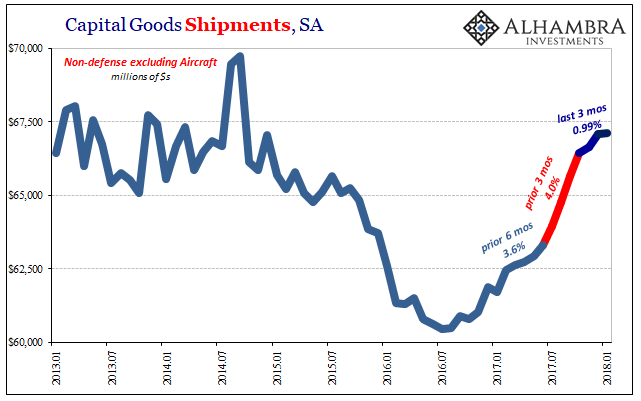
Since the very same distortions are found in the capital goods series, too, it stands to reason that what happened in that period wasn’t the beginning of an economic boom after all. Rather, it conveniently fed that narrative and so was often used in that manner. Whether or it that was intentionally disingenuous depends upon the context, though in truth there wasn’t any excuse since this was all very predictable.
To get a sense of the distortion, we can do some back-of-the-envelope extrapolations to plot where each series “would” have been had the tropical summer weather never intruded. Using the growth rate for the first six months of that year period, creating a counterfactual case that we shouldn’t view definitively, the difference is substantial.
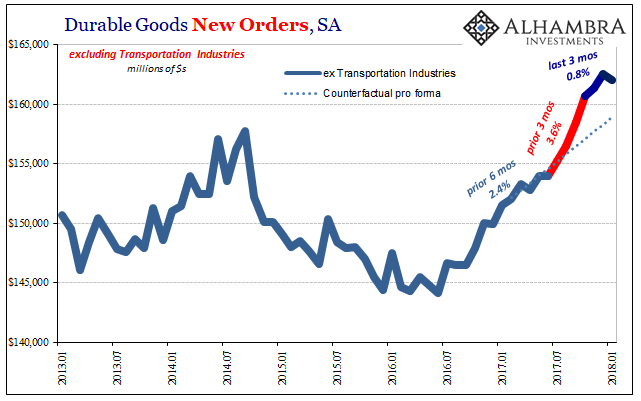
In terms of durable goods new orders, the year-over-year growth might have been something like 4.9% rather than 9.1%. The latter figure isn’t all that robust to begin with, but is at least comparable to the last upturn in 2014. If the storm distortion was as large as suggested here, then durable goods would have been significantly less than all that, greatly undercutting the narrative.
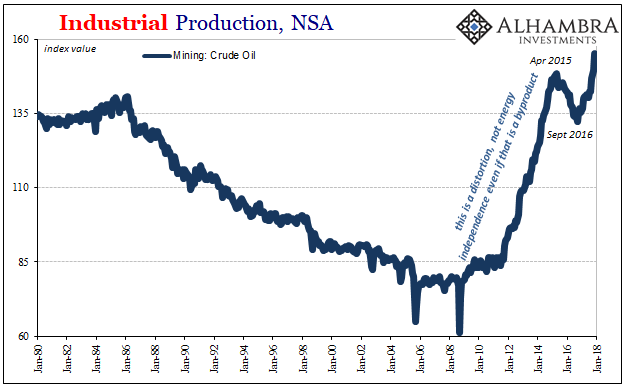
One intriguing subplot of this current rising trend is the oil sector. In capital goods especially, what might the economy have looked like had the shale boom never occurred? In just the raw data, the correlation between WTI benchmark oil prices and capital goods shipments (or new orders) is one that appears during and after the crisis.
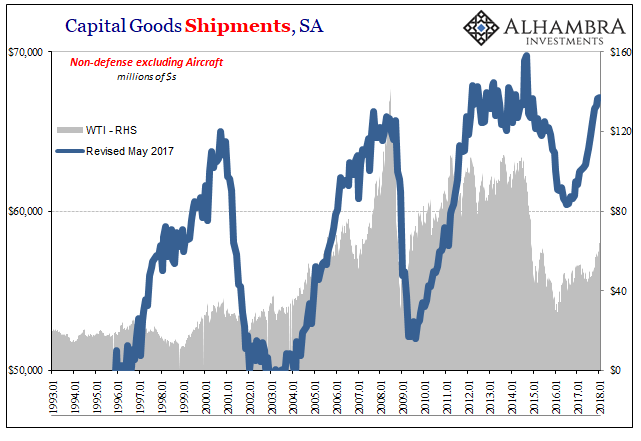
It certainly wasn’t like this prior, where oil prices had been flat to lower for decades going back to the Great Inflation. Not only that, US oil production had been steadily declining the entire time, too (as you would expect).
Now there is a clear correlation which shows just how much production, and therefore the demand for capital goods, at the margins is influenced by almost pure monetary factors. It isn’t supposed to be like this, what Austrians would call malinvestment.
Incorrectly filed under “energy independence”, that has been essentially a side effect of what is clearly a gross distortion in capital resource allocation. What I mean by that is the oil price being a byproduct of the 2000’s “weak dollar” and therefore uncontrolled monetary (eurodollar, dark leverage, etc.) expansion led to a higher price point with which to explore more difficult areas for crude oil extraction. Without $100 plus in oil, there never would have been as much capital goods manufacture as there was of late (and, as you can see above, there hasn’t been very much over the last ten years or so to begin with).
Thank you, Alan Greenspan?
Not quite. The concept of malinvestment is quite simple, meaning that for largely artificial reasons (monetary expansion) the process got going and stayed going. If it was a real economic trend it should have been started under organic, intrinsic circumstances related to value (where value is derived from a proper, undistorted price).
It relates back to the prolonged stagnation since 2007, and gives us one sense as to what has shaped the malaise. The negative response in 2015-16, much more than would have happened otherwise (again being careful about counterfactuals), speaks to the precarious economic nature of potential waste; or, at least, the fragility brought about by malinvestment and how unusually susceptible it is to these kinds of reversals.
So, in the one sense the oil patch has been perhaps the clearest contributor to growth in the all-important supply side of the economy. Yet, it has been for all the wrong reasons. That’s how you get a lost decade, among other related factors. If it’s left to the oil patch and its dependence on high oil prices for capital goods expansion, small wonder the economy remains stuck.
For economists, however, it’s Baby Boomers retiring and heroin addicts. The oil boom is about as hollow as the current narrative for the economy.
Stay In Touch