
Courtesy of Bob Williams:
To steal a line from William Shakespeare, Social Security—To be or not to be? Virtually everyone I talk to has the same opinion, “Social Security won’t be there when I’m ready to retire.” It’s an opinion bred by years of talk in Washington ABOUT the problem and pointing fingers at everyone else BECAUSE there’s a problem, and a beltway full of people without the backbone to FIX the problem.
The Social Security Administration itself admits that there are unresolved issues. On the front page of the Social Security statement sent to American workers in 2001 it read: “In 2015, we’ll begin paying more in benefits than we collect in taxes. By 2037, the trust funds will be exhausted…
The Social Security statement mailed to American workers in 2010 said this: “In 2015 we will begin paying more in benefits than we collect in taxes. Without changes, in 2037 the Social Security Trust Fund will be able to pay only about 78 cents for each dollar of scheduled benefits. We need to resolve these issues soon to make sure Social Security continues to provide a foundation of protection for future generations.”
A retired IRS agent described Social Security to me as an elaborate *Ponzi scheme run by the Federal Government—what comes in this month gets paid out next month—there is no Social Security trust fund or reserves. This retired agent believes there will always be Social Security in some form because there will always be workers paying into the system. But as the number of recipients increases due to the Baby Boom Generation and the number of workers declines, the Old Gray Social Security system ain’t what she used to be!
On June 8, 1934, President Franklin D. Roosevelt announced to Congress his intention to provide a program for Social Security. A committee was formed, congressional hearings were held and on August 14, 1935 the President signed the Social Security Act into law. Benefits were to be paid only to the primary worker when he/she retired at age 65 and benefits were to be based on payroll tax contributions that the worker made during his/her working life. As with many government programs workers began paying for it long before benefits would be paid out. Under the Act, taxes would first be collected in 1937 but monthly benefits would not begin until 1942.
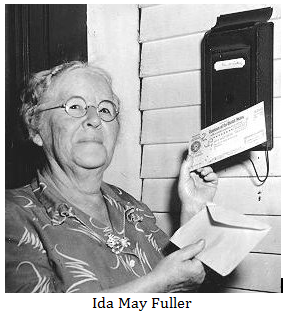
The government finally adjusted the system and payment of monthly Social Security benefits began on January 31, 1940 to Ida May Fuller of Ludlow, Vermont. Ms. Fuller worked under the Social Security system for three years. She paid into the system a total of $24.75. Her first monthly Social Security check was $22.54, almost as much as Ms. Fuller’s total contribution. Ms. Fuller retired at age 65 and lived to be 100 years old, dying in 1975. During her retirement years she received $22,888.92 in Social Security benefits, 92,480% of what she contributed. The Social Security system has been a benefit to many, but as you can see, the Social Security system has been built on a fiscally flawed foundation from day one.
*Ponzi-a swindle in which a quick return, made up of money from new investors lures them into much bigger risks.
In 1940 almost 54% of adult men were expected to live to age 65 and those who did had a life expectancy of almost 78 years old. Approximately 61% of adult women were expected to reach age 65 and those who did had a life expectancy of almost 80 years.
| Table 1: Life Expectancy for Social Security | ||||
| Year Cohort Turned 65 | Percentage of Population Surviving from Age 21 to Age 65 | Average Remaining Life Expectancy for Those Surviving to Age 65 | ||
|
Male |
Female |
Male |
Female |
|
|
1940 |
53.9 |
60.6 |
12.7 |
14.7 |
*Chart from www.ssa.gov.
Today, according to the Center for Disease control, average life expectancy for Americans reaching age 65 is 82 years old for an American male and 85 for an American female.
|
Age |
Male |
Female |
|
|
Remaining Years of Life |
|
|
0 |
74.7 |
80.0 |
|
1 |
74.3 |
79.5 |
|
5 |
70.4 |
75.6 |
|
10 |
65.5 |
70.6 |
|
15 |
60.5 |
65.7 |
|
20 |
55.8 |
60.8 |
|
25 |
51.2 |
56.0 |
|
30 |
46.5 |
51.1 |
|
35 |
41.8 |
46.3 |
|
40 |
37.2 |
41.5 |
|
45 |
32.8 |
36.9 |
|
50 |
28.5 |
32.3 |
|
55 |
24.3 |
27.9 |
|
60 |
20.4 |
23.7 |
|
65 |
16.8 |
19.7 |
|
70 |
13.4 |
15.9 |
|
75 |
10.5 |
12.5 |
|
80 |
7.9 |
9.5 |
|
85 |
5.9 |
7.0 |
|
90 |
4.3 |
5.0 |
This table was issued in 2003 by Division of Vital Statistics, National Center for Health Statistics, Center for Disease Control.
Today Americans are living longer, many are drawing benefits earlier, and we’re on the verge of having more Americans receiving Social Security benefits than the number of workers contributing to the system, all leading back to our original question, Social Security—To be or not to be?
Nary a prognosticator can predict what will happen to the Social Security system. Therefore, all Social Security planning must be done with the facts available today. In future articles we’ll be looking at various Social Security strategies that are available to you and things to remember so you don’t leave any Social Security money on the table.
Stay In Touch