
Despite the title of this post, I won’t presume to call a market top for anything, particularly in an environment rife with artificiality. Asset bubbles include a regular feature of going a long way past any even semi-rational level of departure, before turning on some wholly unexpected event or parameter. However, if you were brave/foolish enough to look for one there are certainly ample signs.
Risk-taking took a bit of a break during the credit market selloff of May/June, but that was only a slight pause. Margin debt and net worth in stock accounts has remained very much elevated.
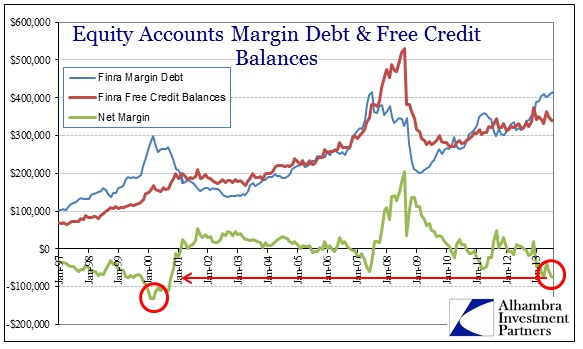
Negative net worth has only been this low (risky) during the absolute mania phase/peak of the dot-com bubble. What is perhaps more interesting is that it has largely remained like this, in a semi-steady state, for all of 2013. That more closely matches the net worth changes in 2000 rather than 2007.
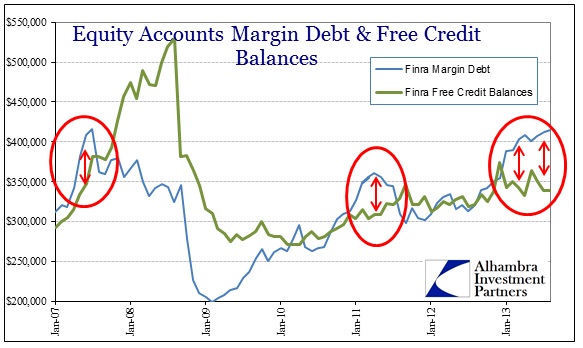
Total margin debt of $414 billion in August is just shy of the $416 billion of July 2007. Again, it is interesting that the build-up in margin debt has been very steady throughout 2013 rather than a sharp move like that of 2007.
In terms of margin balances on the NYSE, we see record margin debt and dot-com levels of negative net worth.
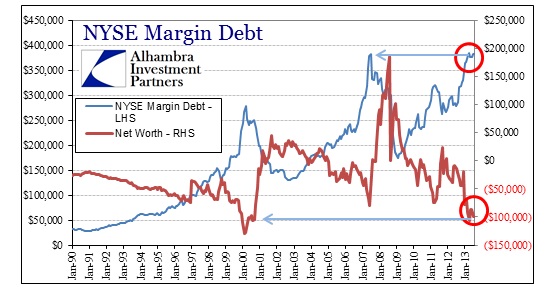
From the perspective of actual dollars in stock accounts, rather than sentiment surveys, retail market participation is at both a new high and levels consistent with previous extremes. The pattern in the 2013 NYSE data is appears to be like both market tops in 2000 and 2007, as clearly investors have gone “all in” this year.
While retail investor positioning may not be a good proxy for the market itself, it does tell us about complacency and the willingness to overlook market “flaws.” These factors play a role in building leveraged positions that have to be quickly unwound, starting the cascade of selling that is common in any market reversal. Therefore we make an assumption that extreme levels of potentially leveraged positioned would correlate with both timing and scale of any subsequent correction. That starts with a striking divergence between market price and market fundamentals.
First, the revenue side of the S&P 500 companies is as bad or worse than the first part of the recession in 2007-08 – and it’s not even close.
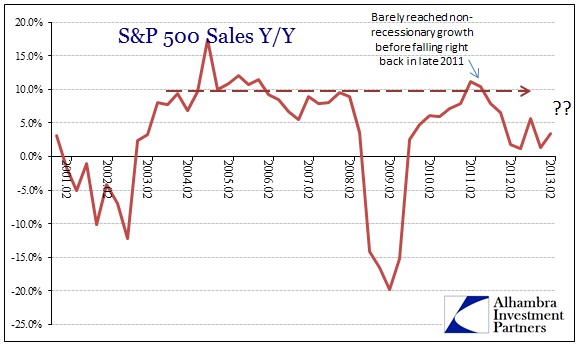
While companies have been able to maintain some positive EPS growth due to over-emphasis on cost cutting and share repurchases, the decline in EPS growth rates, now persistent, suggest there is an end to even that ability to stretch profitability. The first half of 2013 underperformed estimates, but the second half was supposed to be extremely robust – the hockey stick.
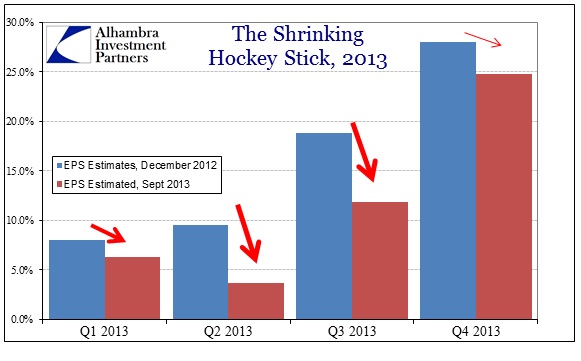
The current EPS growth expectation for Q3 2013 is about 11.8% Y/Y – not a bad quarter at all, even if significantly below estimates from earlier in the year. But that growth rate will likely be reduced (significantly) as earnings come in over the next few weeks. Not only are non-financial firms pre-reporting negatively, there is a heavy element of financial earnings growth in that current estimate that is endangered by financial results under pressure from trading and mortgage shutdowns. Joe Calhoun pointed out that other estimates for Q3 run about 3.2%, meaning there is some real downside to earnings here; absent financials there may be no growth or even a slightly negative rate.
One of the primary market narratives of 2013, in addition to the Fed’s activities, has been a “cheap” market based on forward price multiples. At the outset of 2012, that seemed somewhat reasonable given expectations for $118 in CY2013 EPS. That translated into a forward P/E of 11.9, an inexpensive multiple.
But the problem with forward earnings estimates, as with any expectation, is that they may never be achieved. Eighteen months later, the expectation for 2013 EPS with six months already reported is for $107.86. That, however, includes some hockey stick expectations for the 12% growth in Q3 and an astounding 25% growth for Q4! In other words, $107.86 is still overly optimistic by a nontrivial factor.
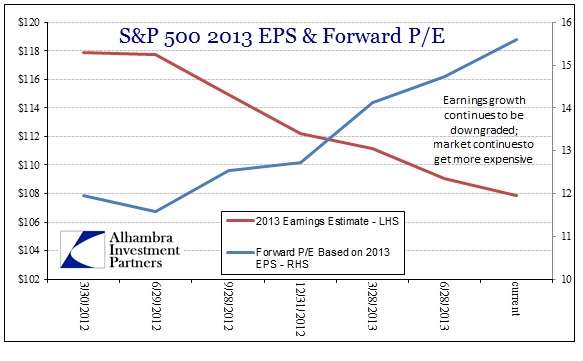
Regardless of where Q4 ultimately ends up, the current market price is 15.7 times current CY2013 estimates. Downgrade Q3 & Q4 EPS a bit more, and the forward multiple that looked so very cheap in 2012 becomes something else entirely. That too is consistent with market behavior at market inflections – what seemed like a solid proposition is suddenly far less so.
Retail behavior is not the only factor to be sure, but together with other indications, including institutional risk taking it makes a case for caution. Markets that rise solely on multiple expansions are susceptible, as leverage in reverse becomes cumulative.
Click here to sign up for our free weekly e-newsletter.
“Wealth preservation and accumulation through thoughtful investing.”
For information on Alhambra Investment Partners’ money management services and global portfolio approach to capital preservation, contact us at: jhudak@4kb.d43.myftpupload.com
Stay In Touch