
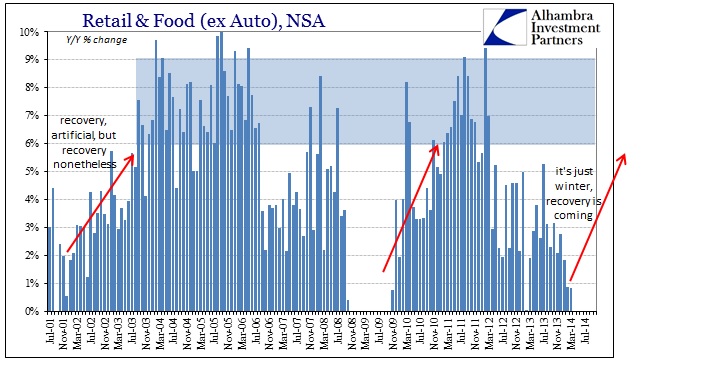
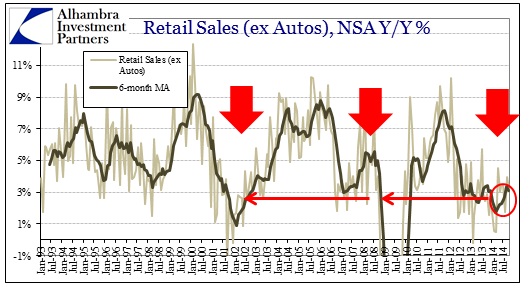
The largest calendar segments of the retail universe are back-to-school followed closely by Christmas. The peak month for back-to-school is August which is usually the third or fourth biggest month of the year in terms of raw retail sales; with October right behind as Christmas retailing ramps up. September, which falls in between back-to-school and Christmas (at least historically), was relatively decent this year (4.46%) given the low standard of the post-2012 economy, but August was a plain mess which was far more important. Y/Y growth in August (ex autos) was just 2.5% which is so far below the 6-9% that “should” be evident in a recovery as to warrant some other classification.
That left retailers wondering if August was the aberration or September. With October’s figures having been released, unfortunately the August pattern has shown up at the start of the Christmas season as whatever happened to “boost” September was gone by the following month. The most important part of the retail calendar kicked off with all of 2.36% nominal growth over October 2013 – a month that inaugurated, at least to that point, the slowest Christmas season since 2009. In comparison, October 2013 saw 3.17% nominal growth, which is why retailers might want to start worrying (apart from auto dealers, of course).
The narrative that has been nurtured this year, especially by the unemployment rate and main payroll report, just hasn’t been fulfilled. While mainstream commentary was confused by the angry electorate, they would not have been so if they actually viewed the economic context through wages and thus retail sales (the two will remain very much correlated unless a breakout of widely dispersed debt accumulation occurs; and thus the GSE’s are trying desperately to loosen lending standards). This year has not come even close to living up to even dimmed expectations, let alone a “recovery.”
When Q1’s disaster was being fully digested, it was asserted as an anomaly that would soon dissipate with the weather. From less than 1% nominal growth, retail sales were supposed to follow the track of something closely resembling past recoveries especially as jobs had suddenly become so “plentiful” and compelling.
So reassurances were made along those lines, to ignore the weather impact and see the full grace of QE and even the confidence of the FOMC in administering its end.
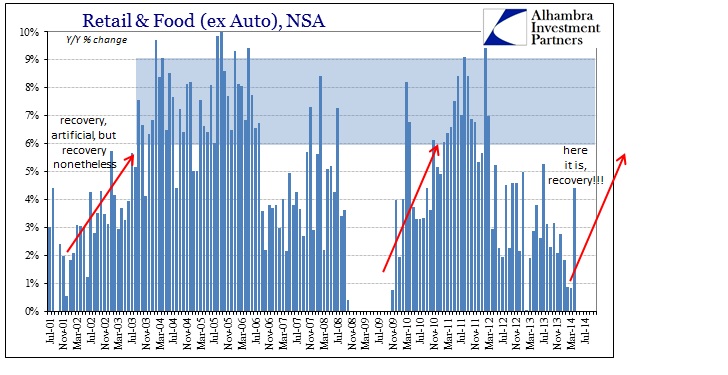
Almost immediately, that seemed to be happening as April 2014’s growth rate pushed above 4%, looking in some ways like that sunshine-driven rebound. There was much rejoicing but also extrapolating about where this was going. But it never really got any further than April as almost immediately the consumer, against all predictions and intents, “somehow” took a step backward.
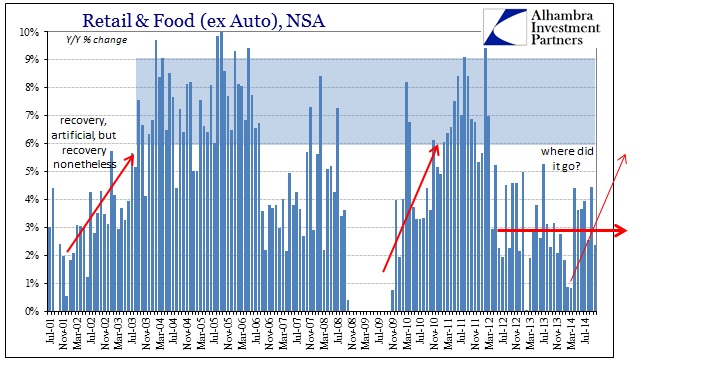
As I said before, retail sales never did get anywhere near that 6-9% range that is consistent with historical levels of actual sustainable consumer activity, instead stumbling badly in August and now October.
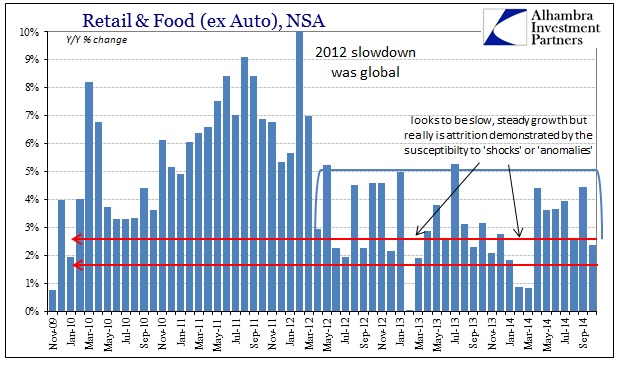
That simply confirms what we have seen since the middle of 2012. The economy is experiencing the elongated cycle that shows up, to economists, as low but “steady” growth. However, the appearance(s) of anomalies are very heady clues that such classification is false and misleading. For two consecutive years, both 2013 and 2014, the prior Christmas season had not only disappointed but led to serious retrenchment immediately thereafter (which the orthodox narrative fell into winter, as if that made any real sense especially two years running). That belies any notion of an economy moving in stable trajectory, low as it may be admitted.
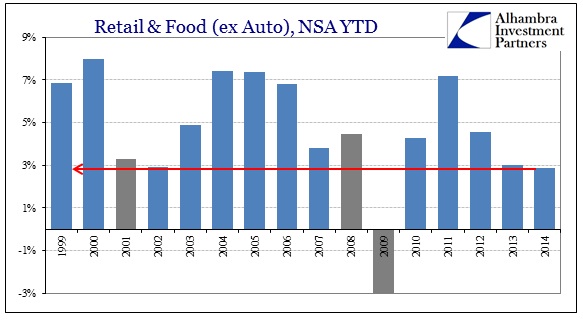
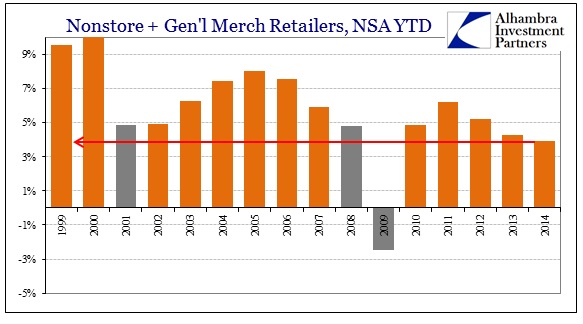
For all this year’s sunny posturing, 2014 is on track to be the second worst (outside of autos) year for retail sales of this century; below even the Great Recession (prior to the total collapse) in 2008 and the dot-com recession in 2001. That is not only evident of total retail sales (ex autos) but also the foundational framework of consumerism through primary retail channels like general merchandisers (such as WalMart and Target). And as the excuses pile up there in terms of the very real shift to online shopping, the cumulative total of both nonstore and general merchandise is also on pace for the second worst year of the bubble period, damning any structural consumer shifts as unrelated to the overall economic picture.
There really is no escaping context, which includes, unfortunately, global growth and the relationship of price changes. China’s problems start with the American consumer’s problems, and that has taken a tinge of commodity price repression in 2014 over and above 2013. So where nominally retail sales are only slightly worse in 2014, taking into at least some account of price changes shows a larger and more concerning difference.
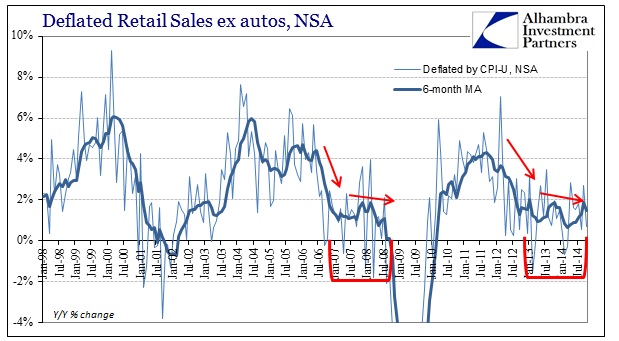
Deflated by the CPI-U, retail sales growth in October 2013 was a paltry 1.96%, yet October 2014 is barely positive at 0.69%. Deflated by the CPI-U Food and Beverage index, October 2013 was 1.83% while this latest month turned negative at -0.35%.
As I said above, all of this data goes a long way toward explaining why the economy remains the top concern of “Main Street” when most descriptions limited to the unemployment rate cannot fathom such dissatisfaction. The economy remains in dangerous territory, running along as that elongated cycle plays out further, which simply means that resistance to negative factors, including price attrition, erodes underneath. Consumers may be telling surveys that they are very, very confident, but they sure aren’t acting like it in spending or voting.
Stay In Touch