
Right along with the growing recognition that there is a systemic problem with labor utilization, and thus wages and earned income serious lag and cap true economic advance, there is at least the coincidence of financial factors that would offer a correlation if not full causation. It may be just that, coincidence, but even that should more than suggest a search for fuller evidence to one side or the other. It won’t be enough for economists (and nothing may ever be under their ideological constraints) to simply assert that there is deeper meaning in how marginal labor in the economy stopped at the same moment the serial asset bubbles arrived and became the dominant factor.
There is enormous complexity in this task in no small part due to the way in which asset inflation corrupts. There is no single idea or conduit to which we can point with unflappable certainty as the “smoking gun” that definitively erases “monetary neutrality” for good. Even with that limitation, however, we can surely augment common sense and intuition with at least a majority picture of the pathology.
This is usually done via the production of stock buyback data, but again that relies too much on rough correlation and assumed causation. Instead, looking deeper within the corporate context starts to reveal some of the manner in which corporate behavior has eroded – and from there we can see the elements of labor or productive rot due to financialism.
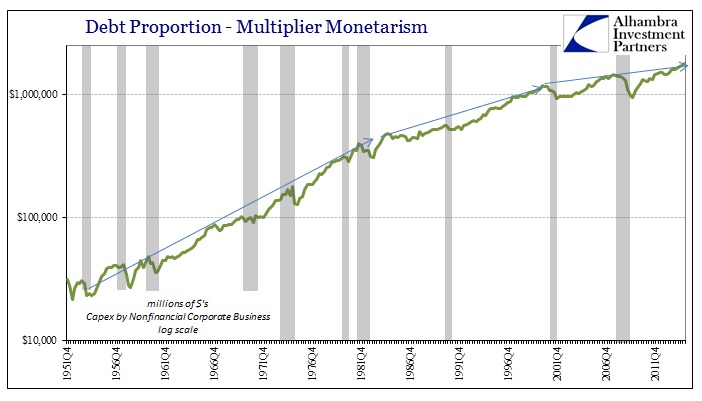
Using the Financial Accounts of the United States (Z1, formerly Flow of Funds), the financialism of repurchases is obvious right from the start. In rough comparison to pure capex, the proportion of corporate financial resources flowing toward financial “investment” matches all perception and instinct about bubbles. (NOTE: the data presented here is for nonfinancial corporate business, excluding the nonfinancial noncorporate sector which is one limitation on producing a fully satisfying reconstruction; however, corporates account disproportionately for total capex spending, 82% in Q4 2014, and all financialism).
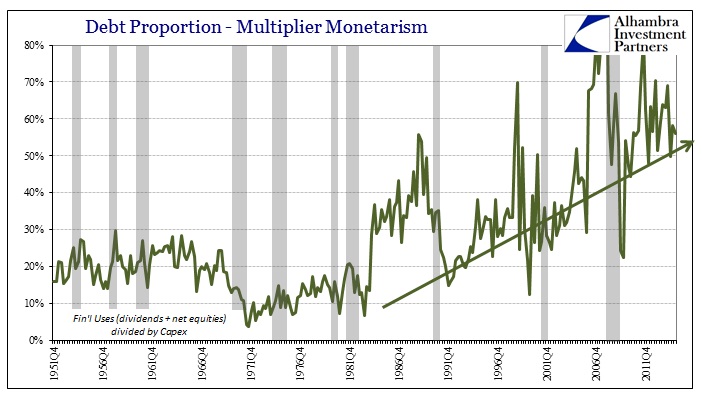
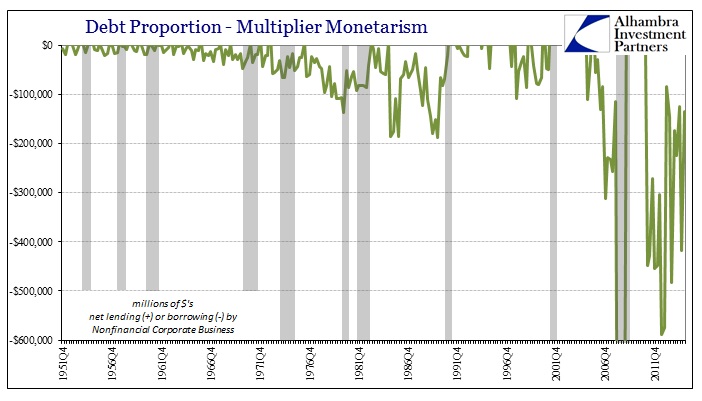
Starting in the early 1980’s, corporate businesses clearly have had an increased interest in paying out dividends, repurchasing shares and buying out their competition (or buying into a new line of business). The height of this imbalance was Q4 2007 right at the onset of the Great Recession, though spending far more in financial matters is not itself an economic constraint or cyclical indication. To complete the picture we have to include sources of funds to go with uses.
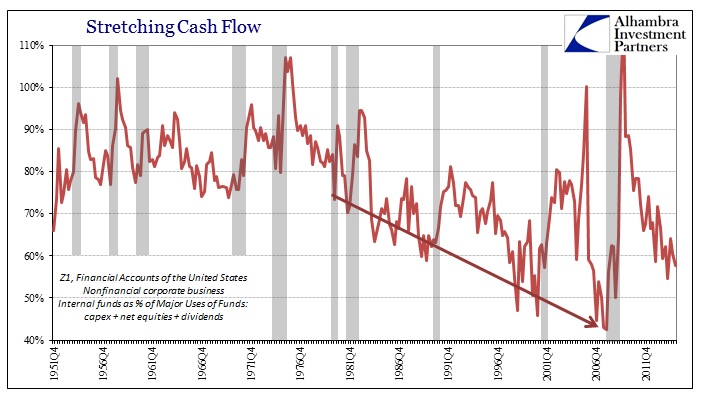
Internal cash flow remains the bulk of financial resources, but as is plain in the chat above the coincidence of a decline in dependence on internal cash flow matches that of the increased financial “investment.” For my purposes here, I am defining the three major “uses” of funds as capex, dividend payments and net equity issuance (where negative equity issuance is a use of funds vs. IPO’s which are a source of funds; the history of equities after the early 1980’s is almost exclusively as a use of funds).
If internal funding sources are not enough to keep pace with both capex and the side of financialism together, the options for corporate business are still broad. Besides using stockpiled cash, corporates can appeal to the credit market through either bonds or banks. However, despite any preconceptions about the current “cycle”, credit market usage and flow have actually been quite limited these past few years in proportion to funding “need.”
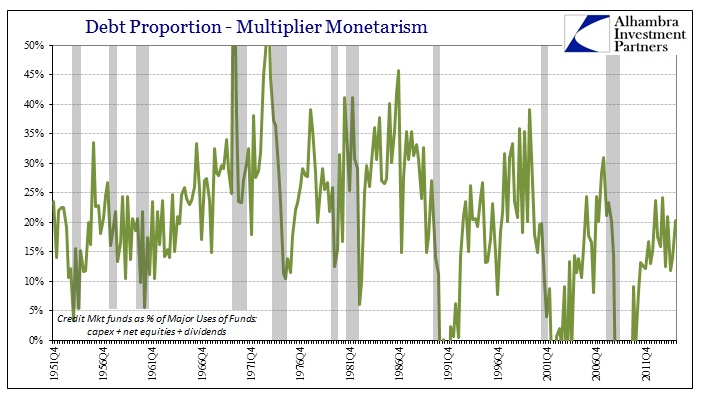
That actually makes sense upon further review, as even though the corporate bond market has been uniquely robust it was largely as a replacement for bank funding after the panic. While that has changed over the “cycle”, by and large banks’ supplies of new credit flow continues to be contained. So the corporate bond bubble has netted the economy and corporate financial position little actual gain by itself. In the context of disproportion about financialisms against capex, the bond market’s workaround meant that corporate businesses could still form the basis of the stock bubble through dividends, repurchases and M&A whereas solely relying on banks would have made that far more difficult a calculation; and perhaps a more discerning funding environment might have slowed the stock advance while tipping the scale of productive focus back in the direction of wages.
Even so, that still leaves a serious hole in the funding picture. Not only have credit market flows been subdued, actual internal cash flows have been downright paltry (not surprising). This “cycle” has been the worst at generating actual cash to corporate businesses, in historical comparison, despite all the mainstream attention to earnings. And it’s not even close:
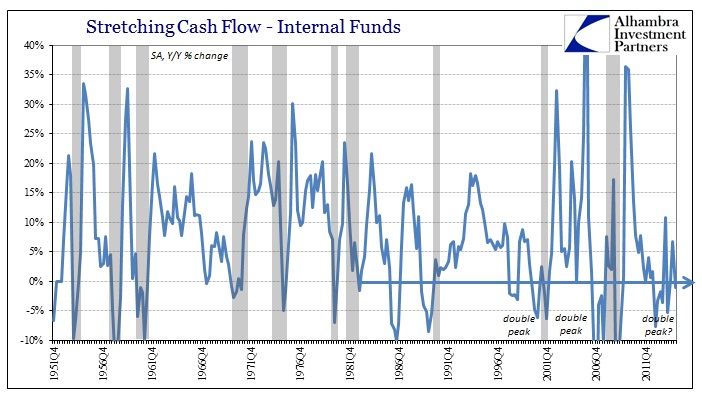
Once again, we see the 2012 slowdown here in the form of negative internal funds growth and then sluggish “recovery” from that elongated cycle peak. This “double peak” pattern was apparent starting in the middle of 2006 coincident to the housing bubble burst, and also starting in late 1998 during the “Asian flu” all the way to the dot-com recession. I think a good part of that elongation has to do with this funding “mystery” as it relates to certainly the financialization of the corporate sector.
Without robust internal cash flows and restrained credit market appeal, the funding of capex and repurchases had to have originated somewhere. If you look at the two sides of the corporate balance sheet, is absolutely clear that this “funding gap” instigates through the liability side. In other words, we can rule out corporations mobilizing their cash holdings, funding dividends et al through their checking account.
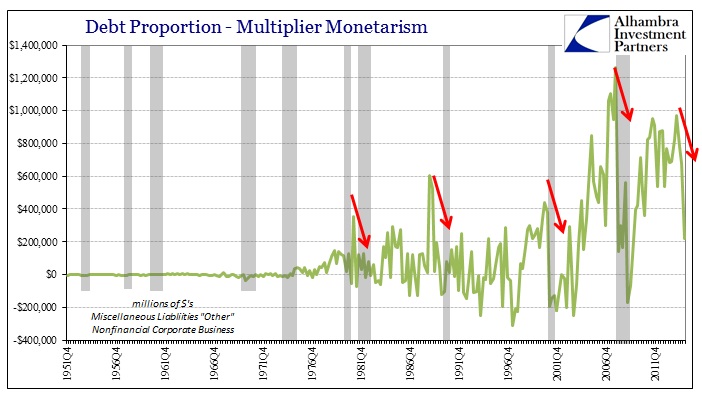
Further, the size of this discrepancy is enormous since about 2004, but first appearing out of proportion back in the 1980’s – again coincident to the bubbles. And there is one line item that stands out for its sheer growing size and matched timing to the bubbles; which means that the mystery funding source is, “nobody knows.”
There are more than a few pluglines in the Flow of Funds accounts, where the Fed’s academic staff and data interpretations simply cannot identify everything. If they calculate, for example, that total liabilities are X and can determine up to 80% of X but no further, they will simply place the “unknowable” balance into one of the many “other” categories.
In this case, the answer, or the unanswer depending on your perspective, lies under the subheading “Miscellaneous Liabilities”, line 53 “Other.” This calculative gap may have started innocuously but during the bubble period it has expanded to become one of the three primary sources of marginal corporate funding.
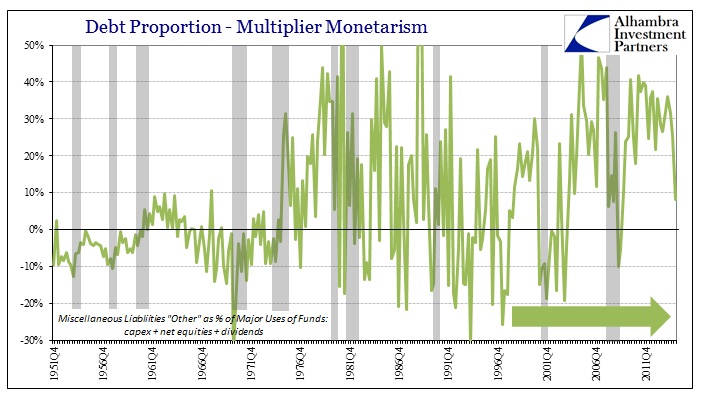
Given the rough dating of this trend to around 1997 it is entirely possible, with what we know of the eurodollar market and its rise around 1995-96, that corporate offshore funding arrangements could explain this discrepancy. This is pure speculation on my part, though, as I don’t know enough about the data collection in the official credit market figures as to whether they have incorporated eurodollar sources or not; but I still strongly suspect this is the origin. In any case, wherever the funding has appeared, it is the only way to close the gap and so we can reasonably surmise that it is real and not just a statistical phantom.
Further, local changes in this “Other” category seem to bear significant resemblance to pro-cyclicality, which would tie this to financialism.
If we match our three major sources of funds to the three major uses the cash flow picture becomes very cyclical itself.
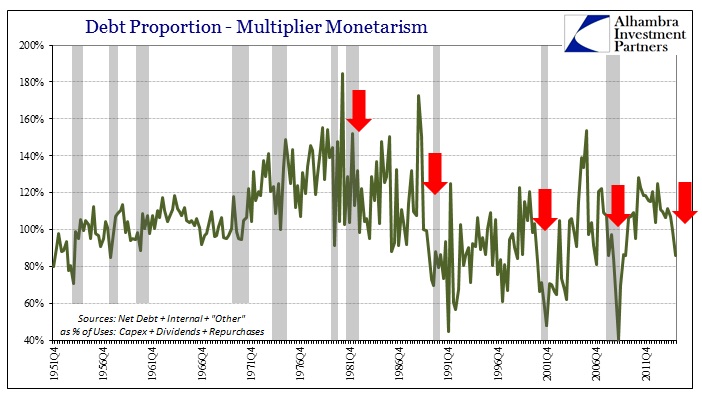
During the Great Inflation, corporate businesses held a liquidity cushion in the form of excess cash flow to major uses. Starting in the 1990’s, that was abandoned in favor of a much smaller liquidity margin and one (as noted above) that was far more dependent on debt growth (either official or this “Other”) to sustain trends. That would seem to explain, at least partially, why there might appear these “double peaks” after the 1990-91 recession. Since companies were relying upon financial funds more so than internal, at the margins, economic slowdowns weren’t solely decisive upon pro-cyclical corporate choices.
This new intermediate cyclical step remained on its own but only temporarily until financial factors eventually turned and complimented the economic weakness. Thus the addition of financial factors for funding sources allowed for a cushion against economic cyclicality (which was as intended by orthodox monetarism) but only so far as buying some time. That would also suggest, and I think strongly, the increased usage of purely financial flow for purely financial means. In other words, this was another form of liquidity margin being expressed in these more “modern” conceptions, as opposed to tying up funding, mismatched as it would have been apart from internal sources, through incremental capex.
Again, the most important observation remains, I think, how increasing financial sources of funding flow relative to internal and organic sources seems to have affected bubble behavior. The availability and ease at which debt or whatever financial source was procured meant that corporate businesses did not have to restrain overall investment from actual economic relationships such as internal cash flow. The implication of that in growing financial proportion was that the increase in financial flow through companies was furthered through additional financial means such as dividends and transactions focused on share prices – banks created debt through balance sheet expansion, even of the “dollar” here, which entered not the direct economy through productive investment and wage growth but as paper wealth and thus “unearned” consumption.
In other words, instead of turning financial monetarism into real economic circulation as envisioned by orthodox theory companies turned increasing financial reach into still further financial methods. And so the proportion at which purely financial resources were available increased the appeal of purely financial returns. This is not just supposition as it actually occurred, meaning that companies made these choices under these conditions and for the obvious reasons. And there was an artificial “temperature” to it all, as the less marginal circulation flowed through the productive economy the less companies tended to want to increase capex (lower returns), and thus direct even more toward purely financial means. If the opportunity to do this financialism had not been available as intended policy under especially interest rate targeting, the economy might have seen far less consumption via purely financial flow and instead more difficult and discerning, but ultimately beneficial in the long run, choices by corporate businesses.
This simply confirms what many suspect of asset bubbles and corrupted behavior, and fills out the picture of financialization even if the direct category of the marginal expansion remains unspecified.
Stay In Touch