
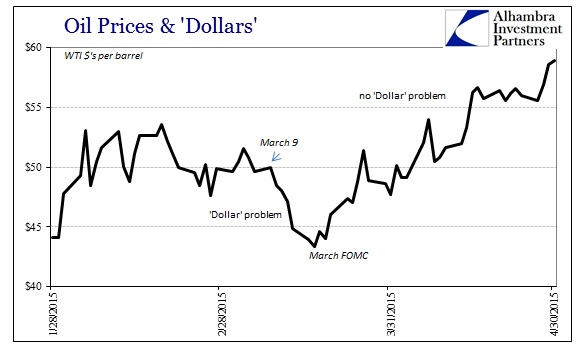
So far, yesterday’s FOMC has not re-ignited the dreaded “rising dollar.” In fact, there hasn’t been much reaction at all as far as funding markets go. Even oil prices remain near their recent highs, with spot WTI as high as $59.40 so far this morning. That is, again, far more a reflection of this latest benign “dollar” than more fundamental demand and supply.
In that respect, the WTI curve is actually twisting. The futures curve “wants” to be in backwardation, so there is already a natural tension against what had been massive contango. But given these funding forces and the fundamental elements of actual physical crude, especially inventory, it is still noteworthy when the front months are bid while the further months (less liquid) are sold.
As of about noon ET, the front contract (JUN 2015) was up $0.32 against yesterday’s settled price, while the JUN 2016 contract was down $0.06. Further out, the DEC 2017 contract was off $0.21.
This trend in the WTI curve has been at work for some time, really going back to that March FOMC meeting. Since then, the “dollar” has been tepid or placid while the back end of crude is still overly stunned by inventory and thus growth prospects.
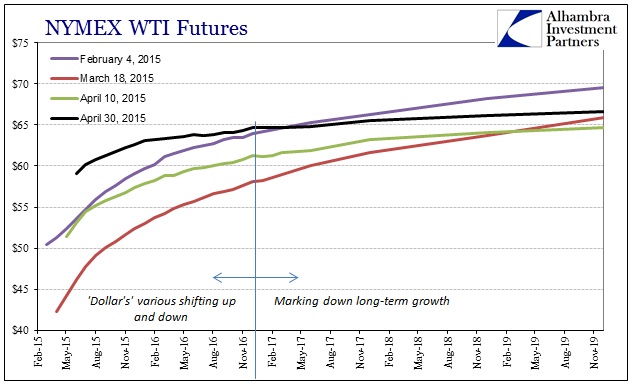
I think that may be where we see backwardation finally creep back into the equation. Almost every commentator expects that this oil drop will be a temporary adjustment, and that the increase in the spot price since March 18 has been used as evidence for that. Given the futures curve dynamics, I think that is demonstrably wrong – if anything, the fact that the futures curve is flattening out still around $65 is major trouble. As inventory of oil continues to build (though at a much more easy rate in the past few weeks) and is awaiting release from contango (futures bought previously), there is the expectation that the price of oil in the future makes it further profitable to do so.
In other words, it is the next step in the contango process that is now under more scrutiny; the physical release. The investor making the contango bet is “paid” off at the outset by the steep drop in the front months compared with the back end. If you were lucky enough to buy crude on March 18 at spot, you could have pocketed an enormous spread out to, say, December 2018 of $21 per barrel. That being accomplished, it is the futures buyer that now has to worry about the outer price as they are scheduled to take delivery in December 2018.
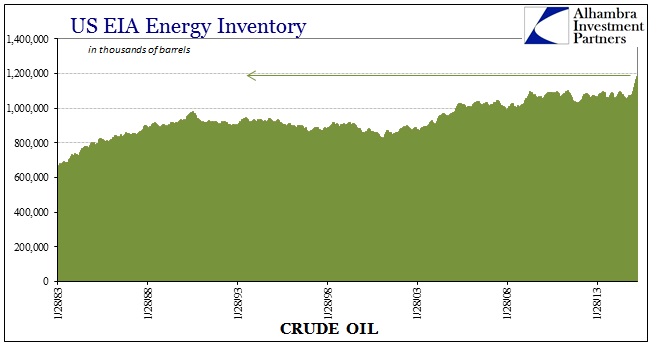
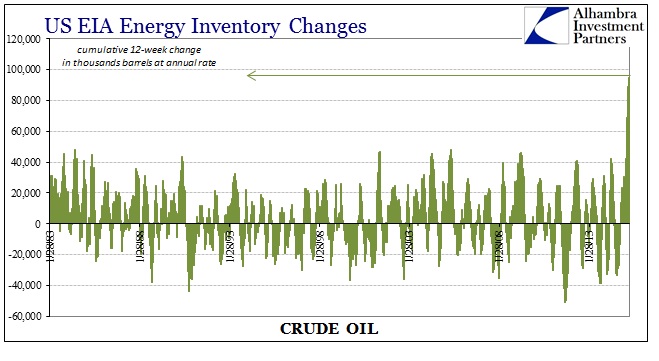
For those expecting “transitory” oil price pressures, they have been severely underestimating this fundamental (as opposed to “dollar”) dynamic. While the spot WTI price has come up almost to $60, the December 2018 price has barely budged. Worse, the amount of crude in domestic US storage has, again, continued to build, increasing the risk of saturation not just today but maybe even thirty months from now. The economic picture between now and then is thus unquestionably important in setting the back end of the curve.
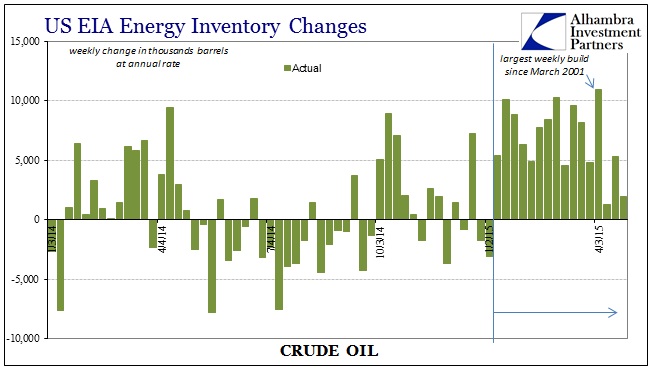
The amount of crude that has piled up is staggering in its dimension, as we have seen nothing like this since oil and energy were in their more formative stages in the 1920’s.
All of that is to say that those making predictions about economic growth and “inflation” based on the front end or the spot price of crude may not be relating what they think they are. Ultimately, I believe, it is where the futures curve reacquires its backwardation that will be relevant to growth prospects. It may not matter much at all if the “dollar” loses its recent benign interrogative, but it is important to keep in mind the physical dynamics as well as those that are financial.
Stay In Touch