
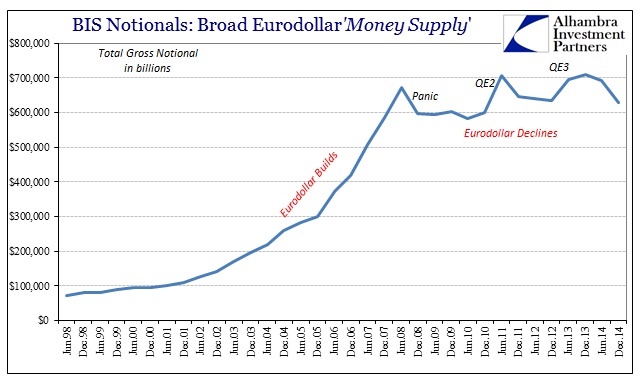
While this was meant to be anecdotal, giving the whole rise and fall of eurodollars an actual feel through actual published bank results, the more abstract collections of the derivatives world conforms very well with those singular sketches in JP Morgan and Goldman Sachs. The BIS, for example, publishes its estimates for the give and take of the gross notional flow in derivatives. Again, assuming that notionals provide a decent proxy for wholesale money supply of bank balance sheet factors, becoming, essentially Var manipulations for expanding (and constricting) actual leverage in wholesale “money”, the BIS totals indicate the same systemic cleavage.
The “money supply” that was growing uninterrupted and distinctly prior to the panic in 2008 clearly no longer is. In the overall category, encompassing IR swaps as well as forex and credit, there were more outstanding in the June 2008 update than the current released estimate of December 2014.
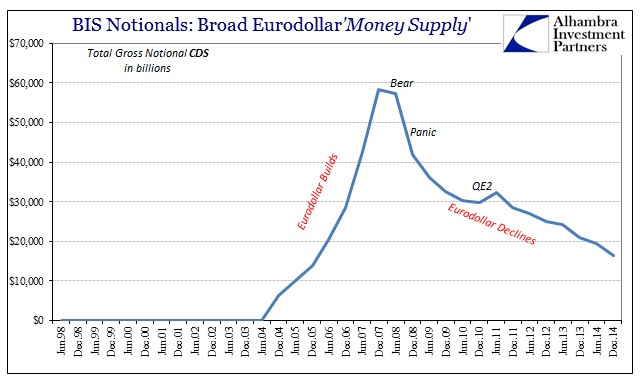
And while that view misses the first phase of the panic, starting in August 2007 but really picking up in Q1 2008, the breakout of credit derivatives, CDS mostly, shows the panic well. In other words, the far more important bank balance sheet “currency” at that time, especially in terms of marginal factor setting, was CDS rather than IR swaps. It was there that pricing and balance sheet factors started the pullback and achieved the depth of panic.
What is interesting as perhaps a final bookend on this examination, for now at least, is in IR swaps and how they relate to QE’s distinctly disruptive mannerisms. In particular, I think the BIS figures show very well why liquidity capacity has essentially disappeared really since QE3 and the first stirrings of taper.
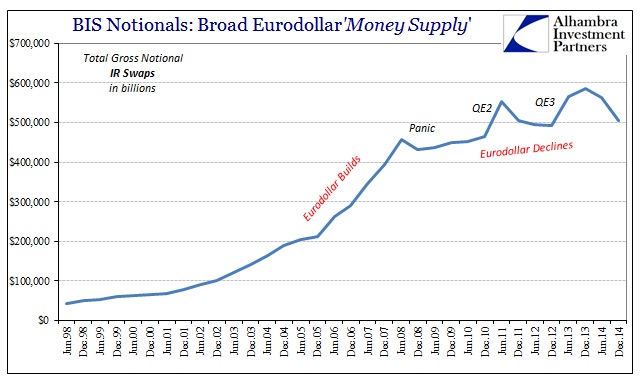
I have maintained throughout, going back to 2013 itself, that I believe that the most damaging aspect to systemic liquidity has been how QE essentially fooled dealers into all going in on the same side of the IR swap trades – that is why the 10-year swap spread, for example, turned negative right at QE3’s announcement and stayed below or at zero bps for months thereafter. That suggested that banks/dealers were all quite willing to pay floating/take fixed because they understood QE to be, as Bernanke more than suggested, hinted and discussed, open-ended if not semi-permanent.
The damage of taper, then, was to undo that assumption which had the terrible effect of putting the entire dealer network on the wrong side at the wrong time. I believe that is why the selloff in MBS in the middle of 2013 was so violent and asymmetric, and I think the BIS figures here show exactly this interpretation of the pre-taper setup.
In terms of “money supply” and balance sheet capacity, we see that in the jumps in total notionals tied to the QE programs themselves; and then the drop in “supply” when they finish. We can also plainly see that the tightening in “supply” is much deeper in 2014 than any of the prior contraction periods, which, again, matches both anecdotes and data from around the “dollar” world as our experience of it.
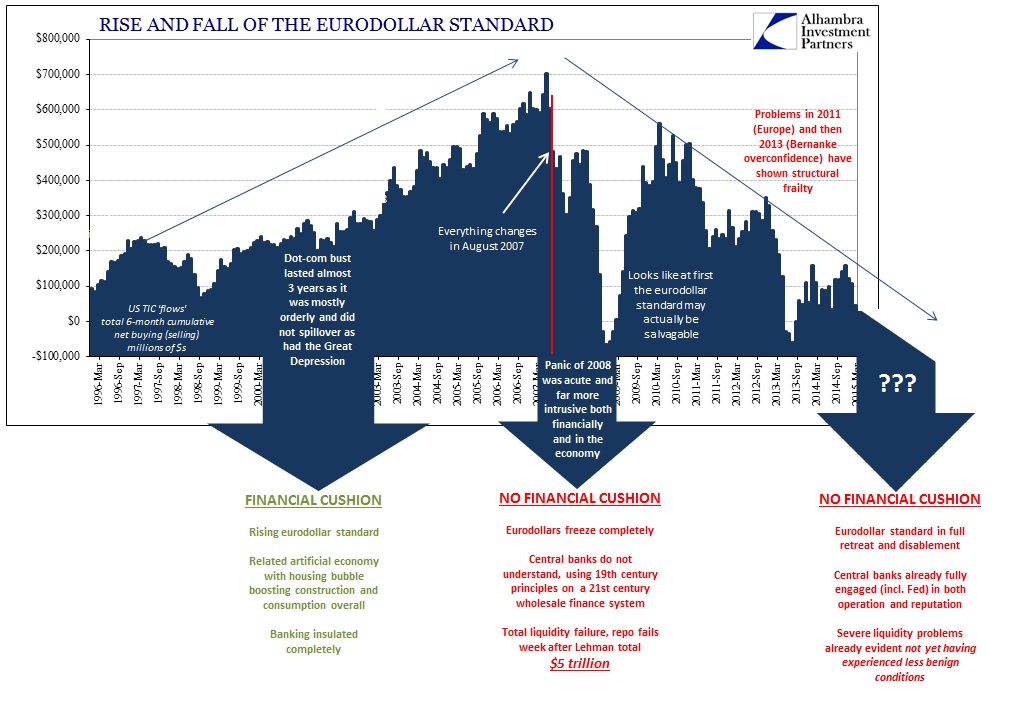
In short, more confirmation that the eurodollar system has run against irreparable decay tracing back to August 2007 – and all the consequence that might apply from that.
Stay In Touch