
The TIC update for August estimates provided some clarity on several accounts. Given the nastiness of the “dollar” environment in that month it was certain that the Treasury Department would display negative “dollar” conditions, and that was the case. The numerous subcomponents and categories were quite useful in corroborating that picture, even if there was some work and re-orientation in unpacking it.
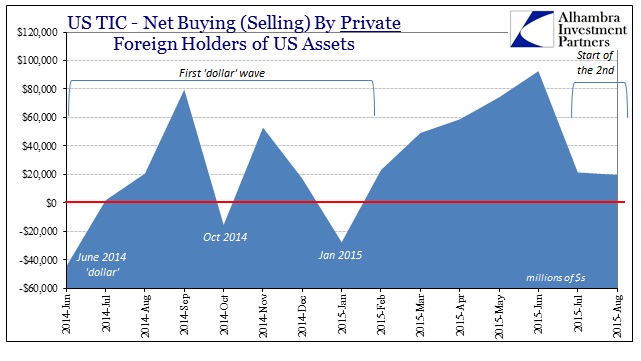
On the first count, the total net of foreign US$ flows was negative again for the first time since January. Here we have to be careful in distinguishing the relative changes of not just official vs. private but also private flows relative to whatever recent baseline. As you can see below, private net “buying” appears especially robust in 2015 exactly contrary to the obvious realized condition of wholesale “dollar” funding.
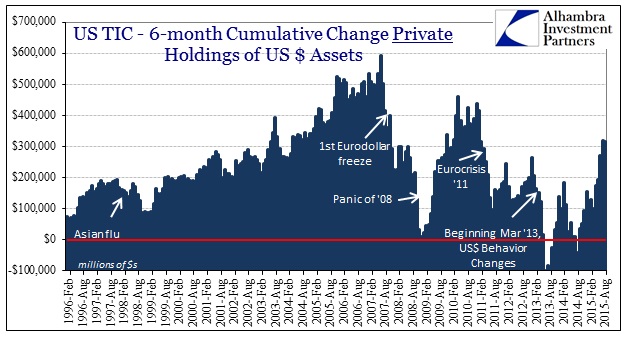
On a cumulative 6-month basis, private flow was as positive as had been seen since 2011! Upon closer inspection, however, the outlines of the “dollar” waves become apparent; thus, that huge “inflow” occurred only in the interim period between the first and the second waves. The more benign conditions that dominated those months, particularly after the March FOMC, must have seemed almost complete Goldilocks – the FOMC being far more patient in giving “lower for longer” at the same time “transitory” still held widespread favor and plausibility. It was, given the more direct turmoil overseas, a window of orthodox “cleanest dirty shirt” in clear practice.
Stark and betraying reality intruded right at July, correlating and thus corroborating the numerous inflections around July 6. In the monthly totals, the outline of the start of this second “dollar” intrusion is obvious even if it was still, contrary to the first, a net positive “inflow” into US assets. Thus, the seriousness of the second wave is not the sign in front but rather the second derivative change peak to potential trough; the change June to July 2015, from +$93 billion to +$21 billion, is nearly as great as that of September to October 2014 which produced the “computer glitches” of October 15; +$79 billion to -$15 billion.
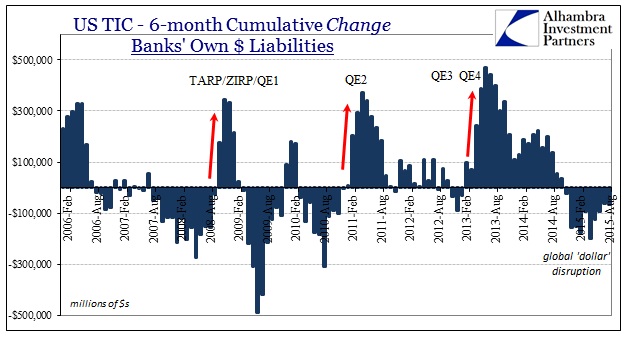
Where the “dollar’s” recent story only begins in those relative departures, it is far more dedicated instead to the official side of the ledger. Here, the “dollar” problem was just historic in August. The TIC estimates provide for an absolutely astounding -$41 billion “flow” just from foreign central banks and treasuries; that was the single largest monthly “outflow” in the entire series, besting even November 2008 when the Fed’s dollar swaps were active out to nearly $600 billion. As noted with every TIC statement, official “outflows” aren’t truly that but more equivocated as “dollar” mobilizations attempting to fill in or calm private “dollar” markets in wholesale funding at local eurodollar connections.
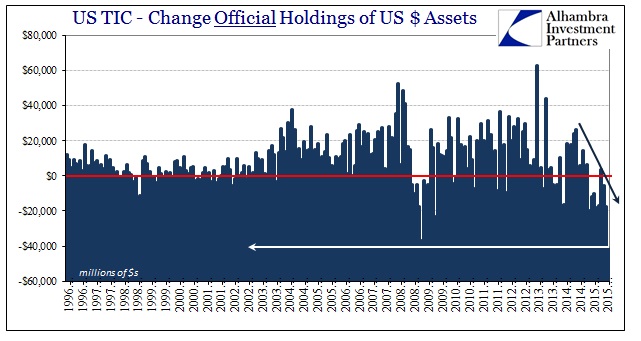
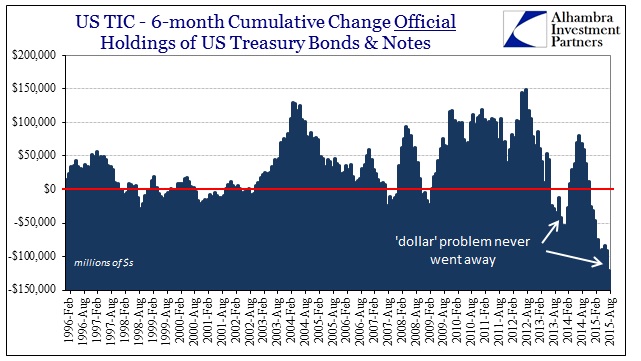
On a cumulative basis, the “dollar” hole being supplied (badly) by these central bank actions is truly enormous and without comparable scale (though 2008 might have provided that absent those dollar swaps via the Fed). Since last December, the recorded “dollar” negative is almost $138 billion and nothing like what we have ever seen before. The reason for that remains as it has been since August 2007; eurodollar banks no longer wanting much to do with eurodollar money “supply” and money dealing (including dark leverage; more on that below).
Without any active, sustained central bank programming eurodollar banks wither.
The action in official attempts to plug that gap are going to fall toward China and the Asian “dollar” but it should be pointed out that China has not been alone in this regard, only the most visible and conspicuous of those despondent central banks caught up in the “dollar’s” gaping vortex. But even with China, the exact method of wholesale funding programs and activities is far from straightforward. While commentary is fixated upon “selling UST’s”, the TIC figures assign no such interpretation.
Upon the Chinese official accounts (admittedly for whatever they may be worth) there is only a leveling of UST “buying” activity during the “dollar’s” second rising run. It is instead Belgium that offers the mystery and the potential answer for Chinese difficulties.
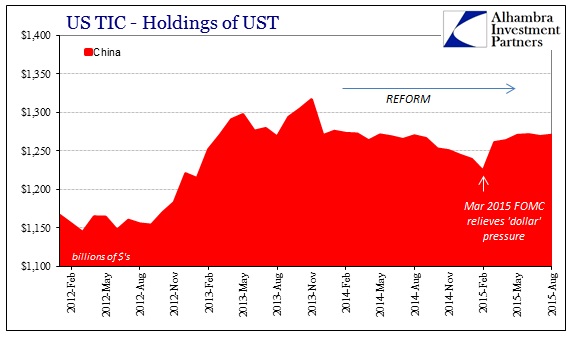
There may have been some of the outright “selling” of UST in at least the first “dollar” wave, but upon the second the character of PBOC potential is completely different. When the surge in reported UST assets at Belgium first appeared in the TIC figures in late 2013, my inclination then was to assign a shift of domestic collateral toward Euroclear as it related to noises about Dodd-Frank imposing clearinghouse and other restrictions upon derivative dealer activities. It was ZeroHedge who first pointed out the potential Chinese connection on the later downside.
In hindsight, then, my theory about Euroclear appears to be quite incorrect instead rather likely to have been some kind of Chinese/PBOC “reserve” positioning in wholesale varieties most likely linked to their intentions about reform. Recall that starting in late 2013 the reform agenda was rather sweeping and dynamic about a great many financial factors, including opening up renminbi trading to more liberal forces (and testing actual credit defaults). That may have led Chinese state banks toward such a collateral shift with still Euroclear’s derivative exchange.
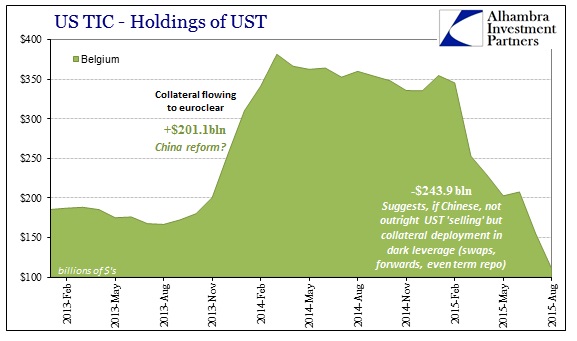
This other, uglier side then suggests the same category of activity but in at least reverse under different intents and circumstances. In other words, not “selling UST” but rather, as we know with some certainty already, deploying of all manner of wholesale mechanisms like forwards, swaps and surely some term repo. Obviously, currency liberalization has been put on hold, no less indicated by the tight range enforced by the PBOC on the yuan/”dollar” for five months leading up to August 11, and now its looser but no less dedicated grip on SHIBOR and other “dollar”-related yuan factors.
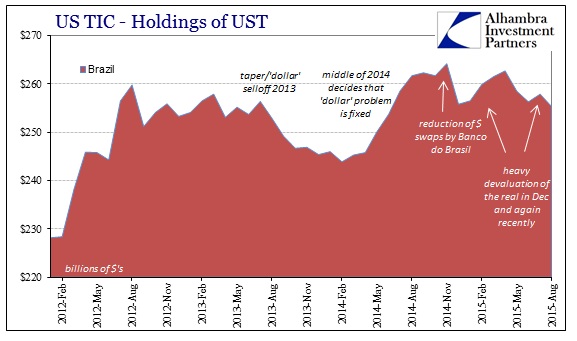
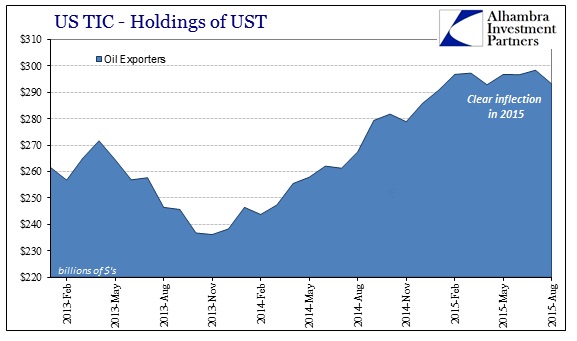
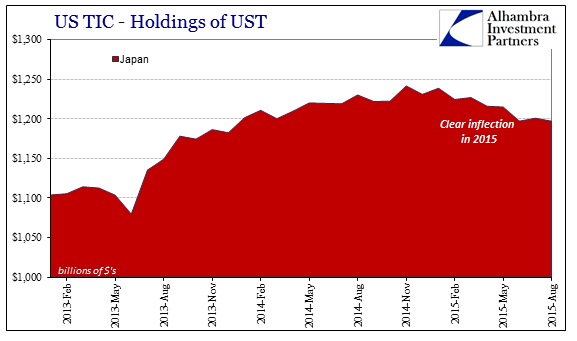
That would suggest some additional asymmetry beyond the scope of these TIC figures (which is not surprising on several accounts; TIC is not comprehensive, only what is reported; China reports very little on its own; and banks and their “dollar” activities fall somewhere in between all that). What is more visible is, again, that China is not alone in its official sector struggles. From Brazil to even Japan, “dollar” wholesaling is in some high degree of irregularity. For Brazil and the oil export countries, for example, that isn’t surprising but the addition of others like Taiwan (dating back all the way to 2012) and Japan suggests both that hidden asymmetry as well as its more Asian aroma.
In short, a great deal about what we thought of the global liquidations of August is corroborated at least in part by the figures provided by the Treasury. That includes the starting point of the second “wave” in July and further points to almost purely financial disruption to this point; European and American banks retreating almost as fast as they can while foreign central banks, especially Asia and EM, are stuck trying to figure out how to deal with that and faring rather poorly (both funding and economy) while doing so. What makes this all especially concerning is that, in my view and sense, all that through August has been conducted under expectations and perceptions more aligned with Yellen’s “transitory” fantasy. If it got that bad under conditions where almost all were willing to fight for the status quo, what happens if they throw in the towel realizing the status quo is not just a losing proposition (inevitably so) but a very costly one (especially in economic terms)?
Unfortunately, swap spreads already suggest at least the banking part and the huge and unappreciated withdrawal of balance sheet capacity (true eurodollar “money supply”) moving rapidly toward finding out.
Stay In Touch