
As banks have trickled out their third quarter balance sheet filings, we gain more insight into the events of that quarter as well as some additional color as to the ongoing drama of the current one. Perhaps the most startling shift in an otherwise quite busy and at times despondent period was the universal compression of swap spreads into negative territory. As stated before, a negative swap spread holds no interpretative meaning, the very fact of which is the most important element. In other words, we don’t have to figure out what the “market” is saying about a negative spread because it isn’t saying anything other than “something” is wrong (and very wrong with so many and deeper negative and compressed maturities).
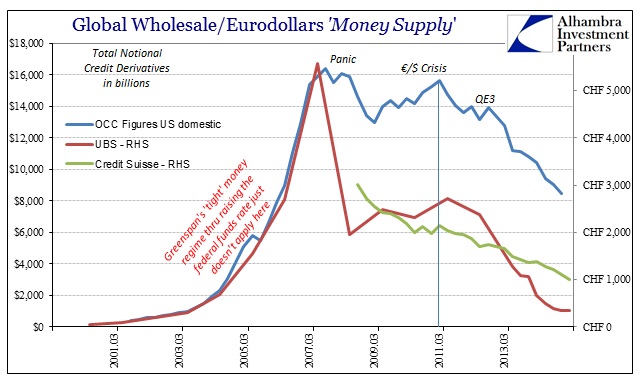
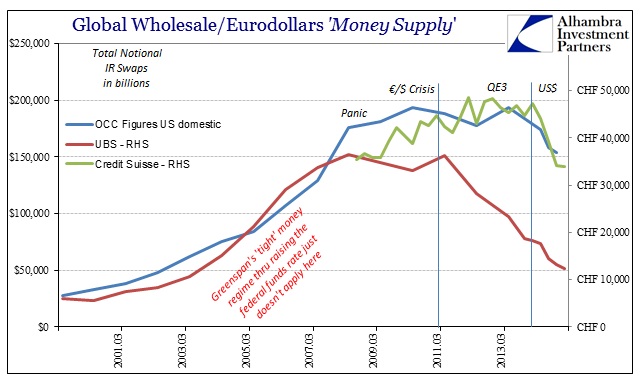
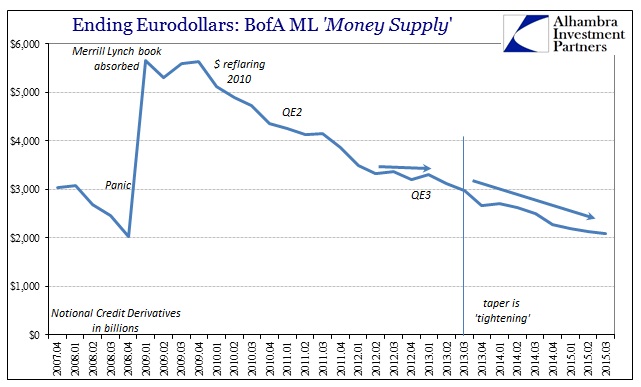
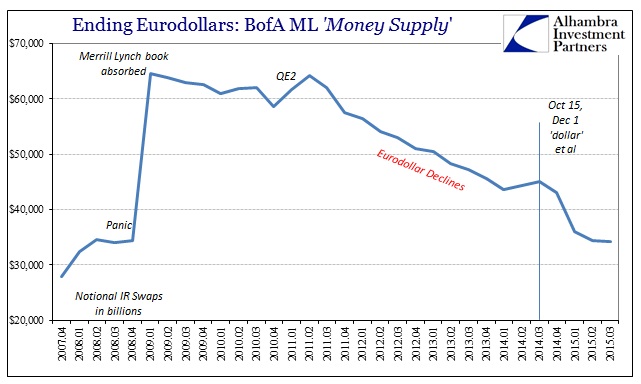
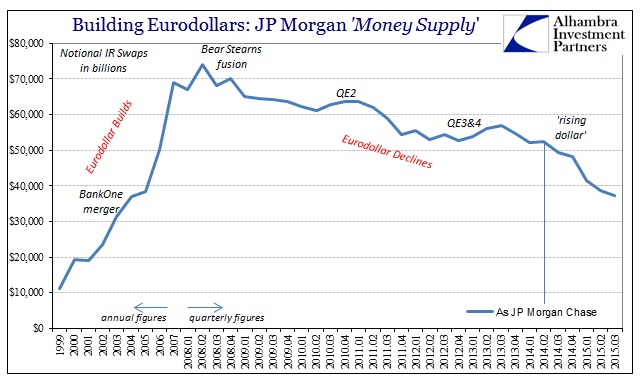
This has been, of course, an ongoing theme that predates the most lucid visuals of the current period; in fact, this is a traceable relic to the Panic of 2008 (which should be renamed the Eurodollar Panic of 2008, or perhaps the Great “dollar” Run). In the past year or so I have chronicled the obvious shift in what I call dark leverage capacity of eurodollar bank balance sheets, mostly in the form of interest rate swaps and credit default swaps (acknowledging that the latter are edging closer to extinction; or are they?). The decline in aggregated gross notional amounts of reported derivative contracts, a simple proxy of approximated balance sheet capacity “offered” by dealer banks, has been simply stunning.
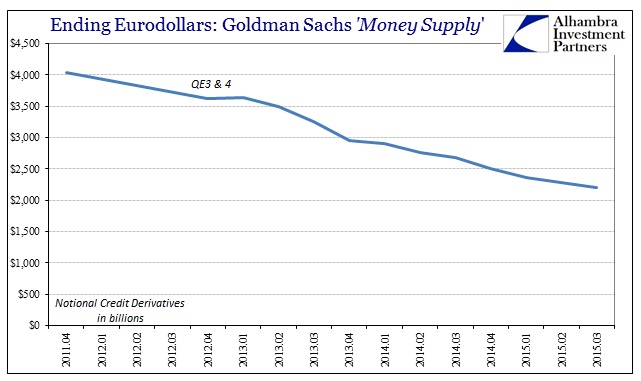
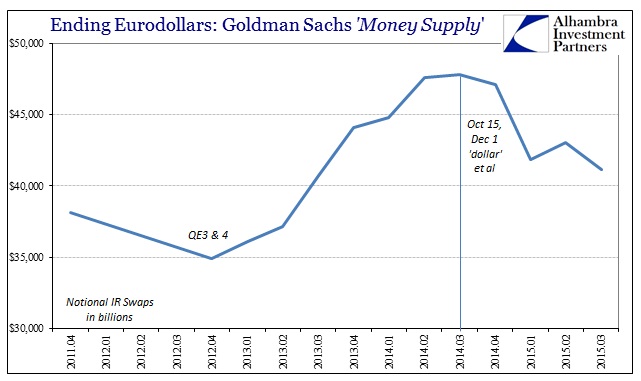
Therefore, it seems logical that if swap spreads have turned so very drastic in recent months we might expect an even more remarkable withdrawal of dealer capacity reported with Q3. That hasn’t been the case, however, as gross notionals continue to decline but only slightly in Q3 compared to the dramatic departure in Q2.
As with balance sheet capacity issues and dealer tendencies during the 2008 panic, we have to remember that there are many sides to such “dollar” dark leverage-drawn liquidity. In very broad terms, dealers are supplying derivatives in order to turn math into money, but that straight away suggests someone on the other side as “demand.” In good part, that is the dealers themselves as they form a partially incestuous circle of issuing “risk” absorption to each other while simultaneously laying it off to each other. This is one reason there is no beginning nor end to the eurodollar space, as it just is.
Again, as you can see below, outside of UBS there weren’t sharper departures in reported gross notionals on either IR swaps or credit derivatives. In fact, the reported balances were in most cases only slight (we will see when the OCC and BIS reports for Q3 are issued if there are any deviations, but given that there are only a handful of impactful dealers in the world and I have captured a sizable portion in these anecdotes that would be surprising).

Liquidity itself is an often misunderstood concept, particularly since liquidity may operate in almost perfection 99.9% of the time; but when it fails on that 0.1% the extremes that result are, to be understated, noticeable. I think it fair to classify the events of August (and September, certainly in Asian “dollar” terms connected to China) as just such an extreme. Thus, if dealers were not obviously retreating in heavy fashion but liquidity produced such results, then the “fault” lies on the “other” side of the equation.
I am going to outline here one possible channel by which that imbalance may have manifested, but I want to be clear this is not the only means by which August’s events may have transpired. There is, as with all things “dollar”, far too much invisible and intertwined for clean theories and conjecture, the multi-dimensional layers upon which so much has been built (and now decaying). I think, in the end, this one example is still quite useful in not just adding texture to what may have happened throughout Q3 (and likely is still in progress) but how that ties many pieces of the economic/financial junction to it.
One of the primary sources of dark leverage/math “demand” is pension funds, an aggregate pool of assets that are simply enormous. Of the $69.8 trillion in estimated household financial assets in the Financial Accounts of the United States, $21.1 trillion are in the form of “pension entitlements” including $17.4 trillion of “funded entitlements.” Of that, there are nearly $5 trillion in debt securities, almost $8 trillion in corporate equities and another $8 trillion in mutual fund holdings (as well as nearly $4 trillion in “claims on fund sponsor”, the unfunded portions that have an actual effect on what I am about to discuss).
Where that is a combined huge pool of assets, it also represents, for fund managers, immense and complicated liabilities. Pensions funds (and insurance companies, another immense pool) have shifted toward what is called Liability Driven Investing (LDI). The main concepts here are connecting and appreciating all the factors driving the present value of all modeled liabilities so that the asset mixture can be efficient and concentrated upon building up excess returns.
The present value function of LDI is as they teach in basic finance, a discount rate applied to expected cash flows; thus, the two most important factors are time and changes in the discount rate. Unfortunately for pension funds, both the Pension Protection Act and FASB rules have mandated the use of “high-quality” corporate bonds as the base discounting rate. You can start to appreciate this element of quite hectic hedging demand in 2008 where corporate spreads increased even for “high quality” names.
In most management theories, the corporate bond yield curve is dissected into two components, the funding component (represented by the LIBOR interest rate swap curve) and the credit spread component. That segments the liability side discount rate risk into interest rate risk and credit risk. In more usual circumstances (for whatever that means), given a corporate bond discounting mechanism it can be expected that rising interest rates are offset by compressing bond credit spreads; which makes some sense, as rising interest rates typically denote quite positive economic conditions which would have the effect of a more favorable view on credit risk in corporates. Thus, hedging demand is, generally speaking, quite placid and neutral.
The opposite case is also somewhat neutral, as entering a weaker economic environment is typically associated with lower interest rates being offset by rising credit spreads. In the dot-com recession, for example, one estimate of pension discount liability rates saw actual improvement since Greenspan overreacted and pushed interest rates lower by about 210 bps (flowed through to LIBOR and swap rates) while corporate spreads only widened (again, IG not junk) by 60 bps. Starting in 2007, however, that expectation for stable liability management did not hold. Despite the interest rate component falling by about 250 bps, the corporate spread piece rose by 300 bps and sometimes significantly more (especially after Lehman). Thus, a higher discount rate applied to the pension liability structure has the impact of turning such math into actual (read: firesales) investment decisions on the asset side.
To hedge this discount liability, pension managers (and insurance companies) use derivatives that deliver the expected mathematical components that fit whatever intended profile. The problem, as always, is these conditions where the “expected” profile is superseded by “unexpected” events (the fact that “tail risk” is a purely statistical concept divorced from real experience by the clearly unappreciated subjectivity of statistics itself). So a massive pool of managed liabilities in late 2008 was increasingly desperate to hedge discount liabilities only to find that dealers weren’t very keen on supply. The result: nonsense swap spreads where the 30-year shocked the financial world by turning negative on October 23, 2008.
The common theme, in this mess of a deep financial viewpoint, for 2015 has been rising spreads even in IG. Since interest rates are either pinned already into ZIRP or modeled to be even rising (where some poor souls still believe in the FOMC) “we” have reproduced the late 2008 conditions for this one liability element. The discount to be applied for LDI pension managers can only go up except where they might have hedging outlets. But, as we know from the Q2 (and really the three quarters before it) figures from dealers, they haven’t been in any way obliged to offer. The result is thus the same as 2008 in swap spreads, only intensified as the compression is forced all across the swap curve.
The blowout in even IG spreads throughout Q3 undoubtedly caused a surge in dark leverage “demand” from at least this one channel (among several) where there was no spare capacity for supply. The favorable pricing that resulted (from the dealer perspective), I believe, explains why dealers reported only a smaller decline in gross notional exposure (but still a decline) even though overall this meant far worse liquidity conditions globally. There are, obviously, many, many additional factors to consider including how interest rate swaps as hedging demand is also applied in managing portfolio duration (a key element of LDI, the first and primary figure of time) and expected or modeled interest rate volatility. Overall, however, an examination of those factors would likely align with this general sketch.
Though I have omitted or simplified a great deal here, I think the main emphasis stands – that in Q3 there was a massive surge in dark leverage demand against a heavily shrunken (and still shrinking) supply, particularly the weak position for it after Q2. At some point, it became self-reinforcing whereby the inability to hedge at efficient prices caused actual (and synthetic) asset sales, further widening spreads and leading to still more demand for hedging against even more shrunken supply. The net result of that imbalance is, again, the nonsense swap spreads we see multiplying and deepening still to November (and tracks back to around July 6).


That presents enormous potential problems for the future outlook in all things “dollar.” Again, with interest rates pinned against ZIRP already and any lingering expectations for a rate hike (or somehow a series of them) can only serve as aggravation on this “demand” side for the math. In terms of economic expectations, the growing sense of recession amounts to the same if not more so as it would continue to adversely impact against credit spreads generally. In other words, by far the most likely modeled path for the future direction of at least pension liability discounting (along with the same in insurance company mechanics) is higher in almost every case – the only one where that wouldn’t be true is where the Fed sticks to “lower for longer” as the economy actually strengthens considerably.
From that current midpoint, we can reasonably assume that both sides of the dark leverage imbalance will remain in their current directions; eurodollar dealers keep looking to exit while swap and hedging demand continues to sharpen. The resulting compressing swap spreads thus act as quite visible signal of continuing and further financial irregularity that only reinforces both sides of the trend to begin with – just as 2008. It goes until the imbalance forces a full-scale break, like that of August 24, with widespread and forced systemic rebalancing.
When I wrote back in September that you ignore swap spreads at your own peril, this is one part that I had in mind – but it is not the only channel. Pension funds and insurance companies represent massive, unthinkably so, pools of both assets and offsetting liabilities that are highly, highly attuned to this math absurdity. Negative swap spreads all over the place, and getting more so, tell us that these huge pools are highly perturbed, as those spread “prices” represent the increasing cost (and reduced availability) of hedging against very real liability upset. Such a condition is, quite simply, highly dangerous. Math is money; and where there is less reliable math, there is less money and then geometrically less patience.
Stay In Touch