
The only piece of the GDP revision to note is that the BEA is still having great difficulty estimating inventory. That isn’t surprising since businesses in this area are behaving far different than any expectation, even factoring the difficulty of the “recovery” environment. That leaves instead only Janet Yellen’s continuous pleading about the surge in consumer spending that never seems to arrive; and now consumers are flushing even this weak consumption environment with revolving credit in a sign of further exhaustion.
In the preliminary release for Q3 GDP, the BEA estimated that businesses added another $62.2 billion in material, goods and finished products compared to an increase (repeatedly revised) of $127.5 billion in Q2 and $127.3 billion in Q1. Given the mechanics of GDP accounting, a smaller increase actually subtracts from the quarterly GDP rate, thus going from +$127.5 billion to +$62.2 billion amounted to a noticeable drag on the statistical view of the economy.
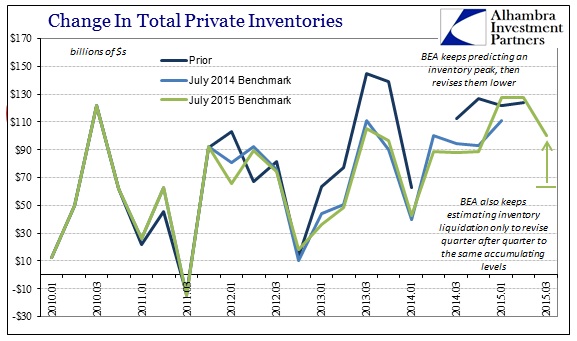
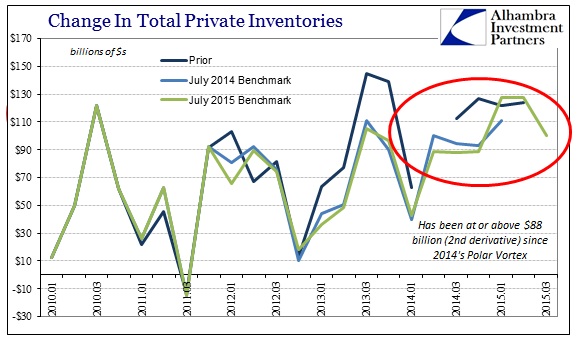
It would stand to reason that after continuous, historic accumulation of inventory that eventually the trend would break, so it seemed perfectly in line with especially the (severe) reduction in manufacturing (and transportation) volume and goods sales and revenue. The advance revision to Q3 GDP, however, has been forced more in line with observations elsewhere that yet again show a delay in inventory reversion. Instead, the GDP calculation of additional inventory was revised up from $62.2 billion to a still-enormous $100.6 billion; marking three consecutive quarters (for now) of more than $100 billion and six in a row greater than $88 billion. Inventory in the GDP figures has not actually subtracted/contracted since Q3 2011!
The last time inventory accumulated without such a break was between Q3 2003 and Q4 2007, suggesting almost perfectly the intentions of the traditional business cycle even in these unusual times. Further along those lines is the fact that despite almost historical levels of sustained inventory gains, scaled to GDP, the sales environment has continually softened to the point that contraction has been maintained in wholesale sales while the retail level has plunged to alarmingly flat (recessionary).
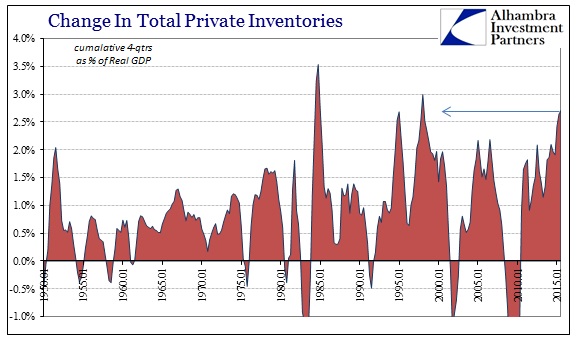
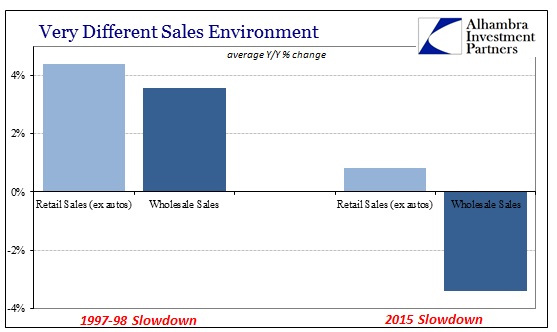
The last time inventory had so steadily accumulated was just before the Asian flu in 1998, a period of also conspicuous and global slowing. The sales environment then was nothing like what we see now, though, as retail sales (ex autos) averaged nearly +4.5% in that slowdown, down from the typical 6-9% that you would usually find during sustained expansion, while wholesale sales decelerated to +3.5%. In 2015, in true contrast, retail sales (ex autos) have barely grown, averaging just +0.83% this year, while wholesale sales contract month after month (average of -3.4%).
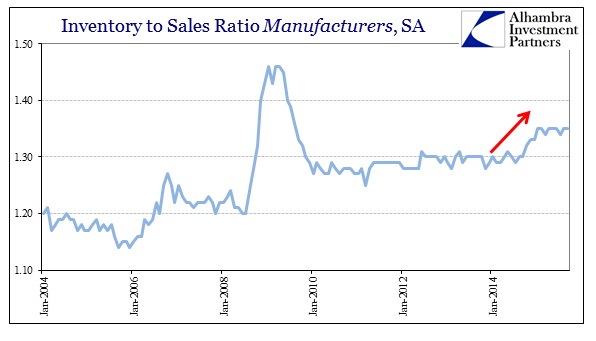
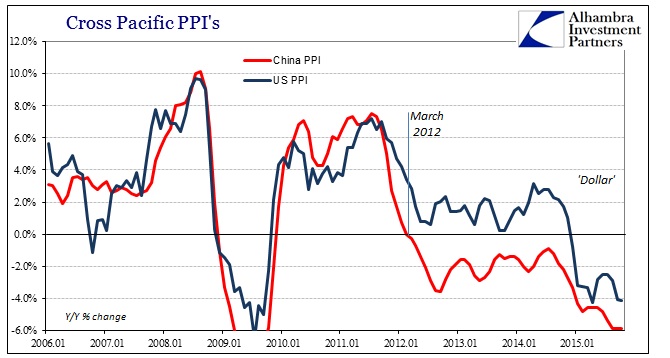
Because of that overall sales environment, up and down the supply chain both here domestically and befouling foreign production (especially China’s overcapacity), scaled inventory levels in the US economy are at highs seen last in the worst months of the Great Recession. And, again, that view is universal the whole of the supply chain, manufacturing, wholesale and retail.
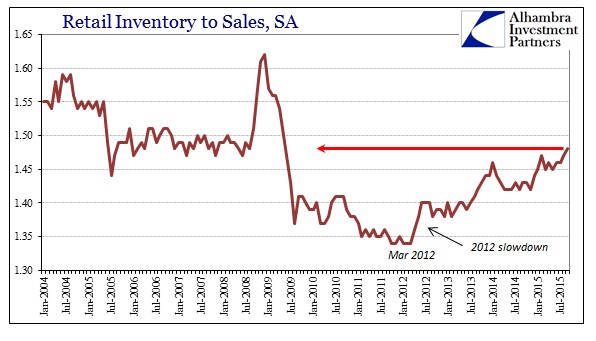
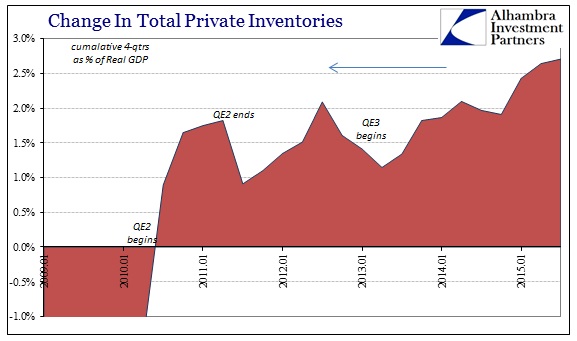
What is odd about all that is how manufacturers and especially retailers are suddenly getting involved in financing and stocking such inventory. Because of this, the decades-long trend of shrinking inventory suddenly and, it seems, durably reversed in the 2012 slowdown (around the time of QE3) without any apparent reason for that inflection. That is the sustained inventory accumulation that “supports” a great deal of positive GDP (and, as the first estimate for Q3 shows, keeps from subtracting an even larger amount from it).
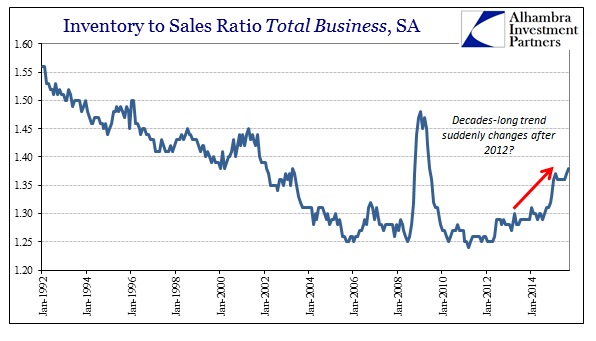
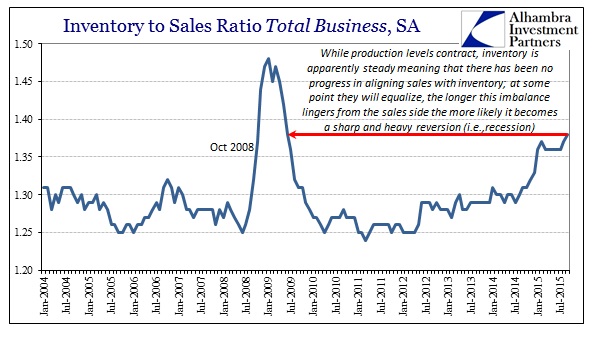
Not only did that long-term, structural trend reverse in 2012 it has visibly amplified just this year and, chillingly, remains so. If this were 1985, the only other equivalent period beside 1998 with such massive and sustained inventory growth, it would be perfectly aligned with broad economic reality of inarguable growth and true booming conditions. Even in 1998, the slowdown was not so severe as to warrant great inquisition (owing, in large part, to the active and economically “useful” asset bubbles of that time) about holding to that extreme – and inventory decelerated anyway, becoming far more uneven all the way to the outright declines that started the dot-com recession in 2001.
What we can infer, rather easily, from the GDP report about inventory is that the BEA is having great difficulty with the estimate. That seems reasonable for once, particularly since “something” is mixing signals about the traditional state of the goods economy and the mysterious unwillingness of businesses in the supply chain to finally align with revealed consumer reality. Again, Yellen’s economic forecasting and her credentials as Fed Chair, and thus chief mainstream forecaster, seem the most likely explanation; a logical if downright scary and thoroughly unearned possibility.
Stay In Touch