
The Chicago Business Barometer fell sharply again in February, almost exactly as it had risen sharply in January. In fact, for the past year that has been the dominant pattern of sharp alternating swings between “growth” and “contraction.” Despite that, months showing up below 50 (this is still a PMI) are still somehow “unexpected”:
Chicago-area business activity unexpectedly contracted in the month of February, according to a report released by MNI Indicators on Monday…
Economists had expected the index to drop to 53.0, although a reading above 50 would have indicated continued growth.
As with all PMI’s, the actual reading is far less significant than the overall trend. That seems to be these wild swings anchored around the 50 mark. Volatility in economic accounts like this tends to suggest increased uncertainty, which would fit this overall environment. From the press release:
The Barometer’s decline was led by an 18.5 drop in Production, which completely reversed January’s near 16 point gain, pushing it back into contraction. New Orders also fell sharply and Order Backlogs slipped further into contraction, a situation that has persisted for a year. Employment also declined significantly, leaving it at the lowest since November 2009 and the fifth consecutive month below 50.
In other words, serious decay inside the report but ambiguously so (especially to the mainstream that still holds on to the recovery narrative) given the comparison to much better January. These large monthly variations actually predate 2015, having shown up in the middle of 2013 and then intensifying in 2014. That, too, fits the overall environment under increasingly uncertain financial conditions (“dollar”) that are playing havoc with any number of accounts and estimates, including GDP it would seem.
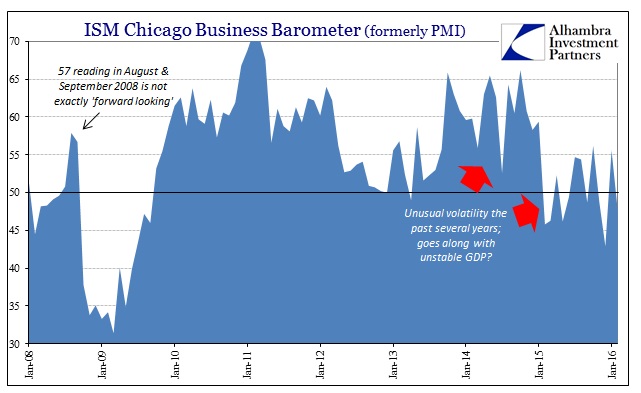
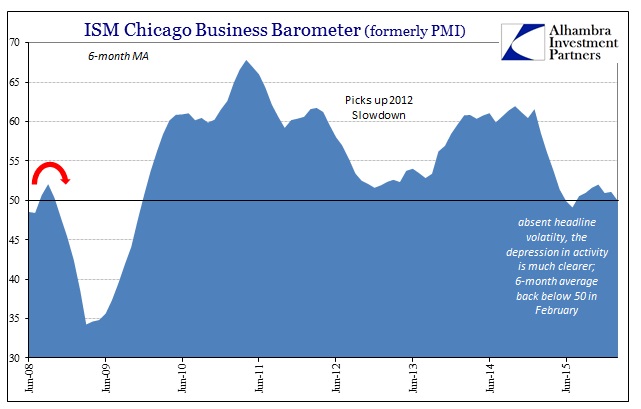
In other words, economic and volatility in 2013 and 2014 has remained just as volatile and uncertain, only now more depressed. The interpretation of that peculiar trend might account for another seeming economic anomaly, that of the very slow downward overall trajectory. This “cycle” is unlike anything seen before, as recessions usually develop quickly over several months at most; the Chicago BB was 66.2 in October 2014 right along with +4% GDP. None of that was meaningful, however, in terms of the future economic course which not long thereafter “unexpectedly” sunk into at least a “manufacturing recession” that continues to somehow linger.
Without usual clarity about the economy or even markets, perhaps it should not be “unexpected” that the overall business climate would not really commit in one direction or the other – instead just building inventory in the hopes that the true trend would coalesce eventually as Janet Yellen promised (especially the version that was forecast in late 2014/early 2015). That clearly hasn’t happened but uncertainty remains nonetheless. That might suggest another scenario where what we see now continues into the foreseeable future, which would be very much like what is already observed in economies elsewhere.
Brazil, for example, hasn’t so much fallen into recession as slowly detached from growth in such persistent fashion as to be almost the proverbial boiling frog. There has been no quick action which usually marks cyclical peaks and then troughs, just relentless contraction now stretching more than two years – “aided” increasingly by similar persistence of uncertainty. Industrial production in Brazil just started declining and has yet to stop. By the latter half of 2015, IP was contracting by more than 10% though it was never really that far out of line given the trend; no radical, cyclical departure growth to recession.
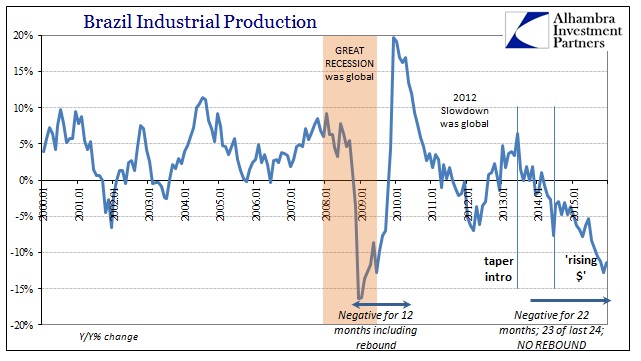
US manufacturing indications such as industrial production and factory orders might propose a similar future. Whereas in the Great Recession, especially immediately after the panic, manufacturing and other related economic accounts went from slightly positive to deeply negative in short order, we might instead witness this incrementalism – losing track of prior history, economists might wake up one day and be surprised that manufacturing is -10% rather than the –8% it was a few months ago, which a few months before that was -6%, and -4% a few months before that. Spaced out enough, and with expected monthly variations (in other words, -4% would not be followed by -5% and then -6%, but rather something like -4% then -3% and -2.5% before another “unexpected” this time to -6%) it would afford numerous opportunities (as China’s slowdown) for repeated suggestions that the worst is over and “green shoots” month after month.
It would be as if an uneven slowdown that just happened to drop through zero and keep going. We have already observed the “drop through zero.”
In Brazil in late 2008, as the US, IP went from +1.1% in October 2008 to -16.4% that December. In January 2014, however, IP was only slightly negative at -1.6% but “just” -3.6% to close out the year; throughout 2014 economists like those at the OECD continued to proclaim there wasn’t anything but “transitory” factors to worry about. Likewise, 2015 started out only slightly worse at -4.9% and by the end had just kept going little by little to -11.4%. It has taken 22 months of continuous gradual decline where the Great Recession was only 12 months of contraction total, sharp as it may have been in the worst parts. At least those worst months were kept to a minimum.
It is obviously too soon to draw any conclusions about the US “manufacturing recession” other than to note continued volatility and uncertainty along with uncanny comparisons (to not just Brazil) including the timing related to the “dollar” shift in the middle of 2013 and then the middle of 2014. In many ways, this would represent the worst case – prolonged decline with no visible suggestion of any renewal no matter how bad it gets; and if it turns out like what we see in other places, it can get pretty bad anyway without the typical recession “V.”
Stay In Touch