
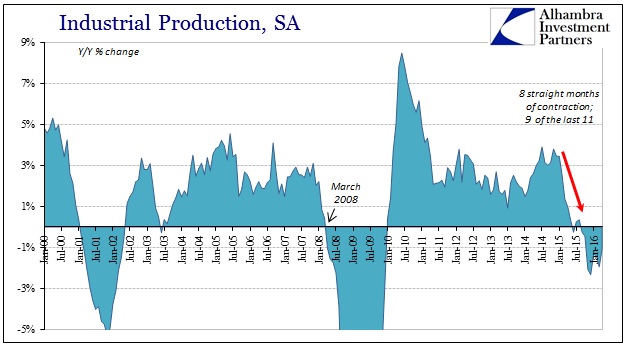
Industrial production contracted for the eighth straight month in April, dropping 1.07% year-over-year. That’s a slight improvement from those prior months but likely only until April’s estimate is revised lower in the coming months. That has been the trend of late in both immediate terms as well as serious long-term revision to benchmarks. As far as the former, it suggests that even though contracting there is a very good chance that US industrial production is doing so at a moderately steeper pace than indicated now.
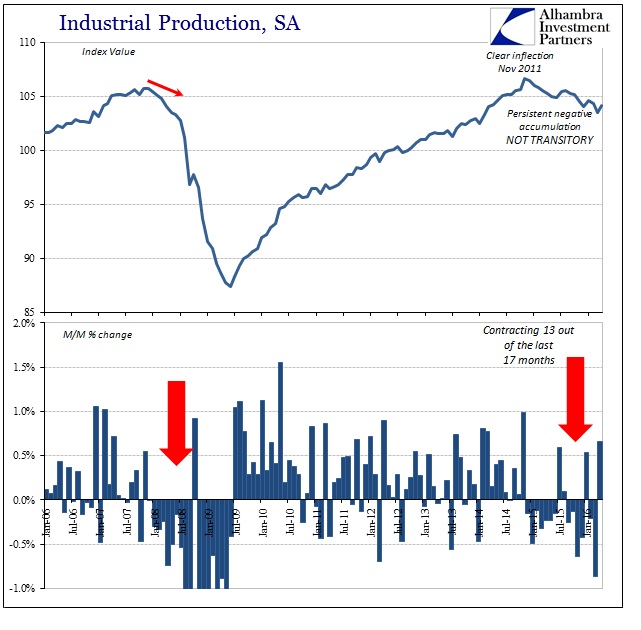
In monthly terms, IP rose in April but again there is no reason to believe that gain will last once the Federal Reserve receives more complete data to incorporate into regular monthly revisions. Even if there was an actual gain in April over March, as you can see below it doesn’t amount to anything more than monthly variation. The trend remains entirely undisturbed, counting now 17 months since the recent peak in November 2014. By comparison, the entirety of the dot-com recession lasted just 17 months in terms of industrial production, yet there is every reason to suspect (more below) the US economy in 2016 is still just getting started in contraction.
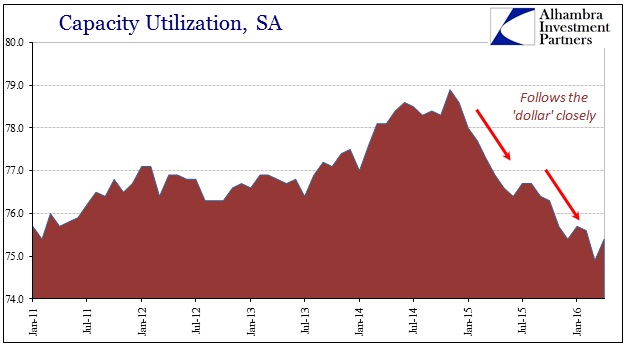
Capacity utilization rose in April to 75.4% from 74.9%, though again there is no cause to believe that will remain the case with further data corrections. The estimated utilization rate in US industrial capacity has been revised significantly both in immediate months as well as at those longer run benchmarks. Since these revisions all run in the same direction, down, there is very little confidence in the accuracy of the figures except that they do agree that in general the “manufacturing recession” continues and continues to get worse.
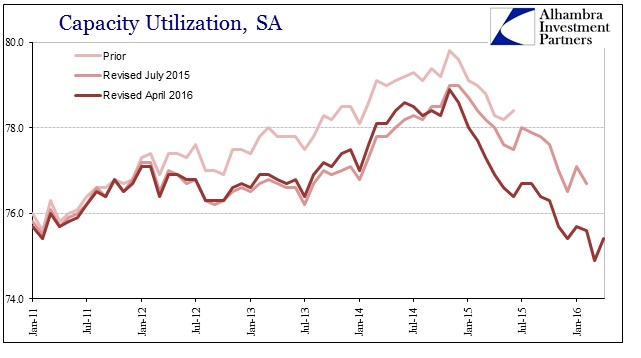
As with many other economic accounts, we find of late that the Fed was serially overstating the level of economic activity and therefore the whole recovery. As noted with last month’s benchmark revisions, the whole IP series was revised downward largely erasing the acceleration in recovery that economists thought they saw in 2014 and even into 2015. That meant the contraction portion of the slowdown is now calculated to have begun earlier in 2015 but more importantly the data series itself has been forced to belatedly recognize the whole slowdown from its start in 2012.
I have persistently charged that trend-cycle bias has been exaggerating economic growth for years and that because of it many, many people (including policymakers who should have known better) were led to believe in an economy that just never existed. The “recovery” has been weak even including trend-cycle, but as benchmark revisions have been added to each data series we increasingly find there was no recovery at all. This is most evident in accounts that deal directly with consumers and consumer spending.
The benchmark revisions from last month for industrial production were, as you would expect, comprehensive among all its subcomponents. That includes the index for the production of consumer goods, a data series that stretches back to 1939. The history of the last three benchmark revisions actually shows trend-cycle in action.
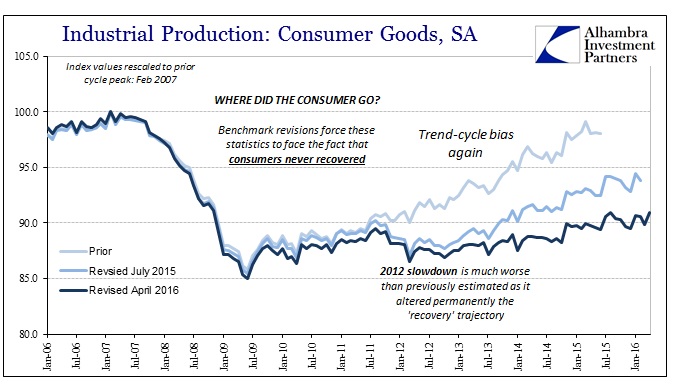
It is difficult to imagine a more stark contrast or miss. As late as two benchmarks ago, the Federal Reserve was showing a straight line recovery – slow but at least steady with no imprint of the eurodollar inflection from 2011 nor the slowdown that is present in so many other places (benchmark revisions or not). Last year’s revision finally “found” the 2012 slowdown (beginning in late 2011) but only estimated that it was, as usual, a temporary deviation from that prior idea of slow but steady recovery. The latest benchmark delivers an entirely difference scenario.
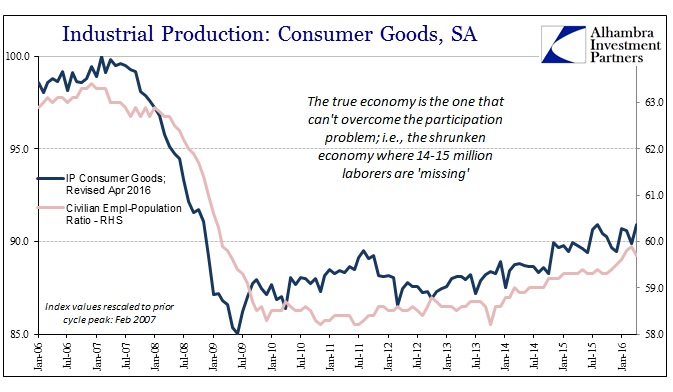
We cannot assign this drastic alteration to normal processes; it’s not as if US consumers had continued to spend but shifted toward imported goods. We find there as here a serious and similar reduction and slowdown, meaning that it wasn’t further offshoring of manufacturing that would account for the lack of domestic production for consumer goods after the Great Recession. Production levels dropped in the recession and then never really came back. It can only be due to US consumers themselves.
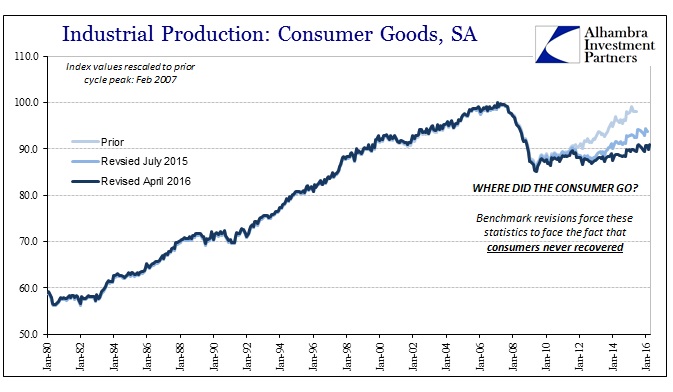
The 2014 benchmark series calculated that domestic production of consumer goods had by June 2015 increased 14.3% since the trough in 2009. That was a significant rebound even though still falling short of actual recovery; the index value for June 2015 in that series remained almost 2% less than the prior cycle peak at February 2007. The current (April 2016) benchmark revisions show a much, much reduced “recovery” up only 5% since 2009 and still unbelievably more than 9% less than that prior cycle peak. Worse, IP in consumer goods in April 2016 is only 1.6% more than August 2011 – five years and really no growth at all. As noted with the monthly revisions above, it is quite likely that the current levels of production in consumer goods will be recalculated before too much longer lower still than even that.
From this view, we see very clearly that US consumers never recovered at all. Some economists have taken lately to suggesting that is a difference of saving vs. spending in an attempt to preserve the idea of the “best jobs market in decades.” However, these revisions suggest blame lies in trend-cycle in a way that leaves little doubt.
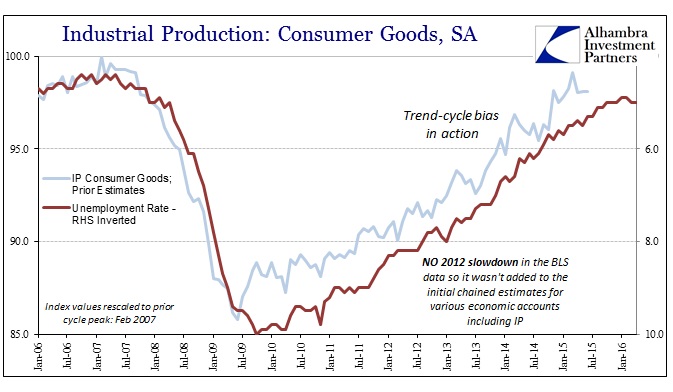
The slow but solid recovery version mimicked the behavior found in the unemployment rate. That makes some sense since you would expect that spending on consumer goods would follow labor gains, and thus domestic production of consumer goods would be correlated to consumer spending (so long as, again, the proportion of imported goods was not significantly different). The problem, then, seems to be in finding a more accurate definition of “labor gains.”
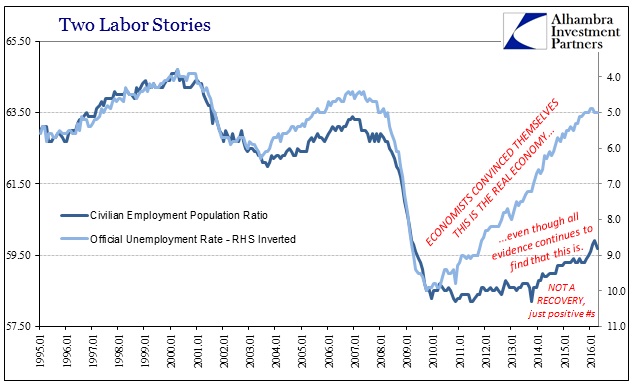
The current set of benchmark revisions in IP shows a decided break with the unemployment rate version of the “recovery.”
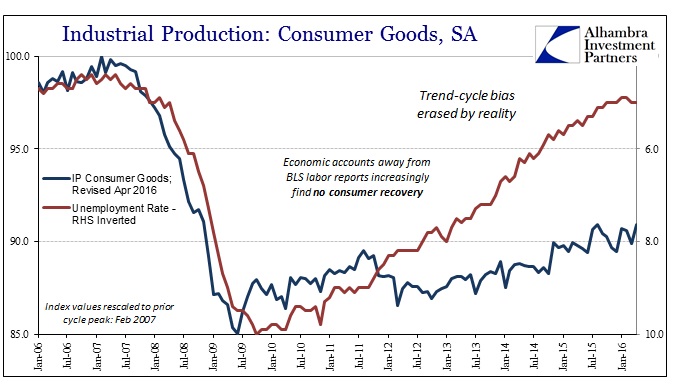
Even though some residual trend-cycle is very likely to account for the still upward track in the index in 2014 and 2015, this revised trajectory is wholly unlike what you would expect given the history of the unemployment rate – particularly the idea of “full employment.” This latest revision in IP outright contradicts that very notion. It does, however, easily find accordance with another, alternate view of the labor market:
In just these last three charts you can actually see trend-cycle bias being unwound by reality. The Fed started with a view of recovery consistent with the unemployment rate only to be forced in later years to actually agree instead with the civilian employment-population ratio. In other words, the real state of labor and therefore the whole economy does not lay in the whole unemployment rate only the denominator just as we suspected all along. Economists have tried for years to suggest that the 14-15 million that “dropped” out of the official labor force count just didn’t matter; a ridiculous idea without the slightest logic to it except the prejudices about “stimulus” always working. This idea was so prevalent and religiously bonded that it was incorporated into the subjectivity that these kinds of economic statistics do allow.
Once more we find that the economy of 2014 was myth, a mirage of statistical anomaly of bias. The BLS continues to figure an unbroken recovery, including still the “best jobs market in decades” even though in the few places where it was once at least a possibility no longer suggest the slightest hint of it. The benchmark revisions in IP are perhaps the most damning, especially in light of consumer goods production and the strong relationship with the state of consumers.
The economy has shrunk with US consumers the primary factor in it. The implications of that are enormous and global, and begin to suggest its true causation (monetary). The production of consumer goods, and the revisions that continue to reveal the true state of it, comes as close to proving that as anything might. This is much deeper and more drastic than just the search for the next recession.
Stay In Touch