
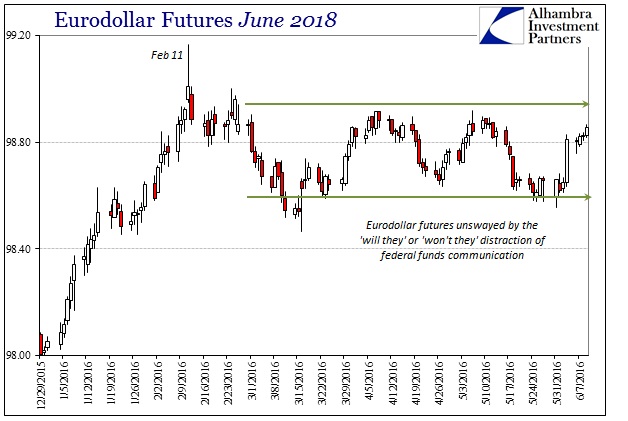
Eurodollar futures prices rose again today, the seventh consecutive increase in most maturities. Six of those days were relatively small moves, the biggest jump last Friday with the release of the payroll report. For the benchmark June 2018 contract, the price is heading back up to the upper limit of the post-liquidation cycling. Trading has been confined to a very tight range between 98.90 and 98.60 dating back to mid-March. No matter what the FOMC and its clowns have threatened to do or not do, the broad eurodollar still apparently waits for some breakout signal.
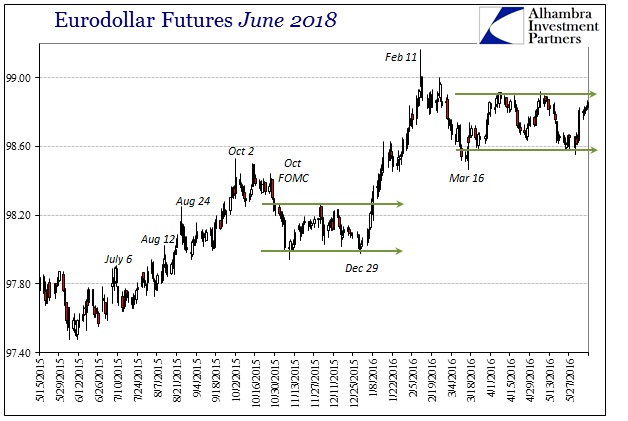
This pattern is somewhat repeating behavior observed between the end of October and the end of December last year. That was the last time the Fed threatened a rate hike and then thought it delivered one. Reaction was muted outside of that initial selling starting at the “hawkish” October FOMC meeting – even after the actual vote in mid-December to do it. This repeating range-bound trading strongly suggests the same perspective and outlook.
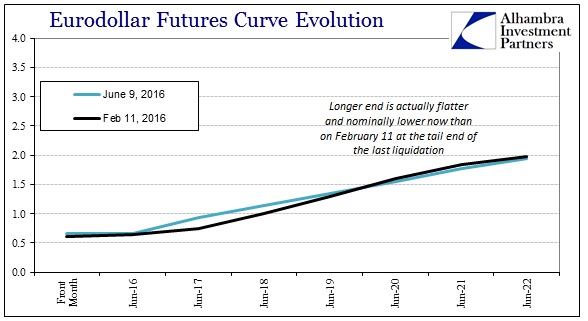
For other eurodollar maturities, however, the range has already been broken. The longer dated contracts, admittedly with much less volume and attention, have already been bid up beyond (in price) the February 11 highs. That leaves the futures curve flatter now than at the tail end of the last liquidation. An ominous result.
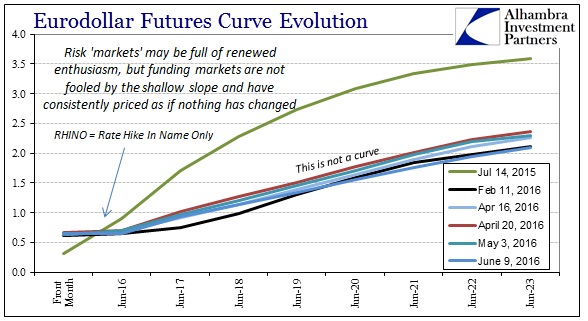
The eurodollar curve might suggest some attention to any potential rate hikes down the road, but the shape beyond 2018 is similar to what we saw all throughout last year prior to summer. In other words, once more it appears that funding markets are trading as if the Fed can only make a bad situation worse. That these futures prices are higher than February 11 already further suggests just how “bad” the baseline might be.
The crossing of the liquidation threshold was not limited to just eurodollars, as the US treasury curve trades in similar fashion. The 10-year CMT yield fell below 1.70% for the first time since February 11. The yield for the long bond, the 30s, actually closed below the yield from that day: 2.48% today vs. 2.50% then.
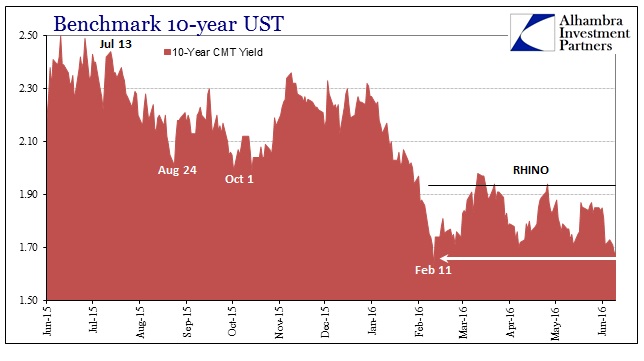
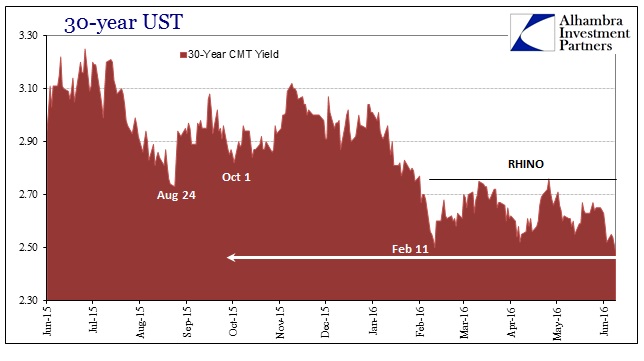
Again, it’s the same pattern as prevailed all throughout the first half of 2015. There was uncertainty about monetary policy and any effects on the shorter ends while growing and more serious economic concerns overwhelmed any of those in the outer maturities. The liquidations brought the two sides together into RHINO (rate hike in name only), demonstrating once again (just like the middle 2000’s and Greenspan’s “conundrum”) how much influence the Federal Reserve actually possesses.
With credit and funding at least in sections moving beyond the February 11 divide, it does raise the prospects for the “next one” that much more. So far CNY isn’t disappointing for its part, so finding agreement in discrete portions of the internal “dollar” isn’t really surprising. It means, potentially, even tighter global “dollar” liquidity that at some point forces the rest of global markets to pay attention again. I’m not sure it adds up yet to a liquidation warning, but perhaps the warning of a warning?
Stay In Touch