
While there is a direct relationship between the steepness of contango in the oil futures curve and the amount of crude siphoned from the market to storage, it is not an immediate one. When crude prices originally collapsed starting in late 2014, twisting the WTI curve from backwardation to so far permanent contango (of varying degrees), it wasn’t until January 2015 that domestic inventories began their surge. And while oil prices rose through spring, flattening out again the futures curve and drastically reducing that contango, the spike in oil stocks didn’t actually end until almost the end of last April.
Given the “dollar’s” explicit seasonality, combined with the usual intra-year swings of crude itself, it isn’t surprising to find the process repeated almost exactly a year later. This time it happened in two separate events, the latter of which was a near replica of the start to 2015. The futures curve was pressed into deep contango after October 2015, and sure enough oil inventories spiked again in early January 2016. And like last year, though the futures curve would begin to flatten out again starting February 12, oil storage levels continued to build until the end of April.
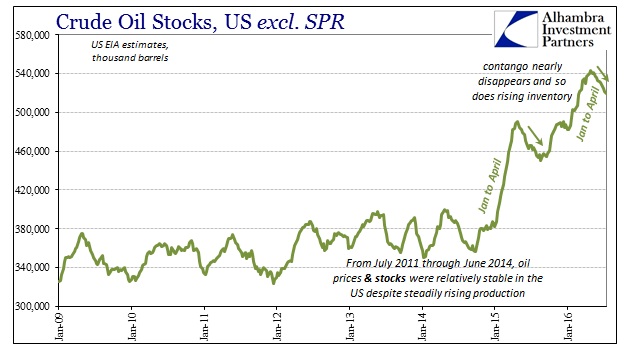
In the latest weekly update from the US EIA, reported crude stocks have fallen again for the ninth consecutive week (and 10 out of the last 11). Last year, starting at the same week, inventories fell for eight straight weeks and 13 out of 15 until mid-August. The shift back toward contango in the WTI curve this year also hasn’t yet forced its way into crude inventories, and if last year’s conditions still apply, as it appears they do, then we shouldn’t expect that to occur until August or perhaps September (whatever natural crude seasonality).
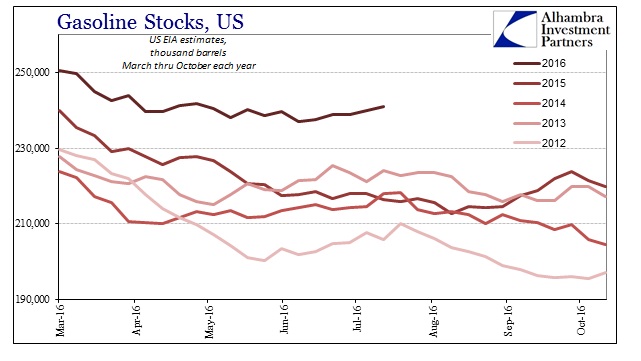
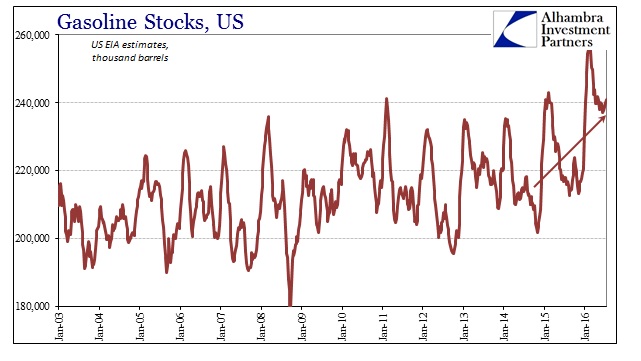
Instead, it is gasoline inventories that are somewhat concerning at the moment. Gasoline stocks remain hugely elevated but in the past few weeks they have increased again perhaps “early” in comparison to the usual seasonal pattern. The summer “driving season” typically finds gasoline inventories falling from levels built up in the winter. This year compared to 2015 finds not only higher overall inventories but a possible suggestion of unseasonably high levels on top of it.
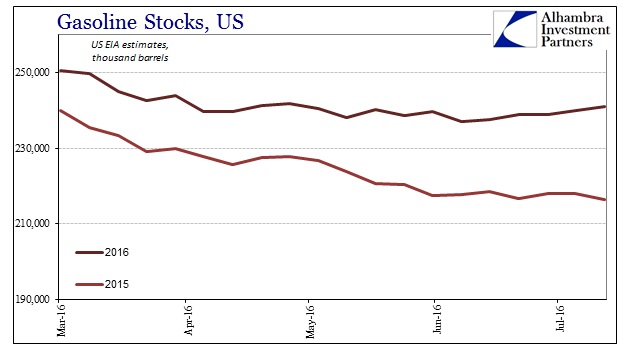
It is difficult to say whether there is any significance in the difference as analyzing seasonality in gasoline or crude is an inexact art, to put it mildly. At the very least, however, the continued high level of gasoline inventory in potentially significant seasonal deviation suggests the very real possibility that (economic) demand remains unusually soft over and above the “rising dollar’s” already soft demand.
The imbalance may correct itself over the coming weeks, or it may continue to suggest more sluggishness where there isn’t supposed to be any. While waiting on crude oil inventory to start reflecting contango in the WTI curve, this might be the only current fundamental element to weigh on crude prices as the futures curve continues to sink.
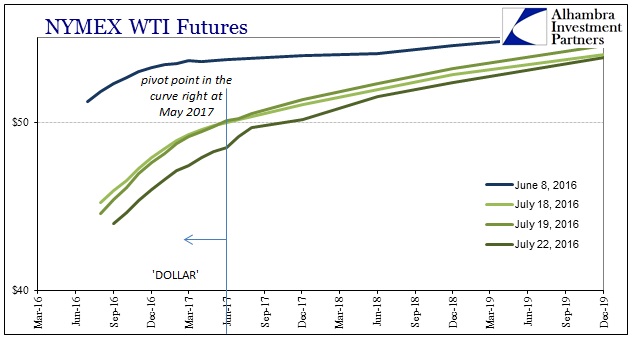
The front month contract rolled forward to September 2016 as August came off the board, so there is some calendar roll to factor in the chart above that can be visually misleading. In other words, the drop in the curve isn’t as sharp in the past two days as it might appear. But it is still falling with more action at the front, and the steepening since June 8 is still increasing.
The significance of crude and gasoline is the difference in narratives and what is supporting them. Stock prices at record highs, or near them, is likely being driven by renewed hope for monetary policy wherever it may strike, all the while forgetting how patently ineffective past monetary policy has been. The energy sector and the renewed drop in the futures curve (the whole curve, though more so at the front) is remembering the consequences of monetary policy that doesn’t work while at the same time finding still little evidence that anything has changed (and some evidence that if something has changed it is only further in the “wrong” direction). Stocks once more trading, though much less enthusiastically, on what “should be”; energy trading on what actually is. All that is also a replay of last year, specifically last July.
Stay In Touch