
Last July, the US Treasury Department finally issued its official report detailing its account of what happened on October 15, 2014. The statement was co-authored by staff at the Board of Governors of the Federal Reserve System, FRBNY, the SEC, and CFTC, as if the government were going overboard trying to prove its word the end of the matter. As to what the volume had to say about the episode, there wasn’t all that much despite its 72 total pages.
Mostly, the work meandered about focusing on only 12 specific minutes.
The U.S. Treasury market enjoys liquidity defined more broadly, with continuous trading and substantial market depth. However, on October 15, specifically in the 12 minute event window, the U.S. Treasury market—while in one sense remaining liquid as participants were able to continuously transact—experienced uncharacteristically shallow market depth. Moreover, the continuous trading in these 12 minutes seemed unrelated to any new information, leading to questions about the efficiency of price formation in the Treasury market during that time. A higher incidence of such strains in market liquidity could prove harmful to the many critical functions this market enables and serves.
There is so much wrong in just one paragraph, starting with the idea that liquidity is not depth. “Continuously transact” is obfuscation. It is not the only one, as the whole thing reads as “nothing to see here” except about those 12 minutes. In short, the alphabet soup of government agencies suggested there might possibly be something irregular about HFT, but even that isn’t very concerning and there was really nothing else worth investigating further.
It’s an odd conclusion from a factual standpoint because there was so much that happened that day, not to mention the days following or even the days leading up to it. In terms of research and inquiry, the period of and surrounding October 15, 2014, was a goldmine of topics, irregularities, and just plain action. Everyone knew, however, that it would ultimately be computers and computers alone that would fall under suspicion and how typically indecisive that would be. As I wrote in November 2014:
That is why I find the electronic trading explanation so lacking in its comprehensiveness, but at the same time I understand why it has persisted. There is a mechanism in UST trading which is supposed to mitigate any such supply and demand imbalances, as the role of primary dealers is to see such “arbitrage” and use their immense balance sheet power to restrain it and turn it back toward “equilibrium” (if such a thing exists more than brief and fleeting moments). That clearly did not happen, so the presence of electronic order systems and even high frequency trading does not explain, at all, the absence of dealers.
Part of the reason for leaving it at the doorstep of HFT is the philosophical boundary of orthodox monetary philosophy. Digging too deep jeopardizes the carefully limited construct of the Fed and mainstream economics. To view the events of that day as monetary irregularity risked(s) undermining the Fed and all central bank efforts. The reality is just that damning:
It may sound strange, but a “buying panic” in US treasury bonds is a form of illiquidity. The modern shadow system has in many ways inverted or at least distorted what could fairly be called “currency” or a “dollar.” As I have said on many occasions, repo collateral is in many ways “moneylike” in its behavior and properties. At times, collateral becomes far dearer than actual currency, or even ledger balances of currency, and thus behaves more “moneylike.” Such derivative function makes straightforward analysis extremely difficult, especially to the outside.
Unusually high demand for quality collateral is a systemic signal; to the degree as witnessed in those 12 minutes, a grave systemic signal. Only a day after, on October 16, 2014, bond market participants began reporting serious abnormalities that only further suggested funding issues not in primary but secondary markets all over the world.
Corporate-bond investors have struggled this week to find trading partners for some large orders, causing unusual price drops and raising concerns that trading could freeze in future market turmoil.
‘Buyers just disappeared’ early Thursday for many low-grade bonds and even some higher-grade ones, said Jason Graybill, senior managing director at Carret Asset Management LLC, which oversees $2 billion.
The Treasury report of last July was cover so that monetary policy as an entire paradigm would not be disproved by actual events. To admit that huge, massive illiquidity could wash all over the world’s fixed income markets and all at the same time (it wasn’t just bonds, stocks dropped significantly, too) would be the same as owning up to the increasingly obvious fact that bank reserves aren’t actually money in the eurodollar system. The Wall Street Journal article quoted above even perpetuated the misconceptions by suggesting the corporate bond market problems were related to the “stock swoon.” That was, of course, nonsense since the WSJ was just following the mainstream view of monetary policy. The Fed might as well have created air or sea shells with its four QE’s, as everywhere else there is monetary shortage that only increases.
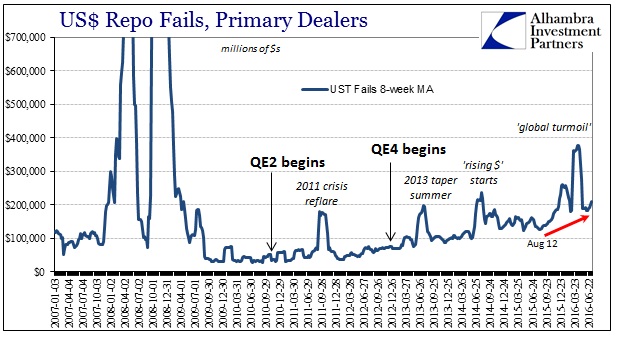
In the US$ repo market, which applies all over the eurodollar world, that is all we find. And as if to further humiliate the government and its childish efforts at holding on to the increasingly unworkable status quo, the repo market literally hasn’t been the same since October 15, 2014. It was never computers; it was always “dollars.”
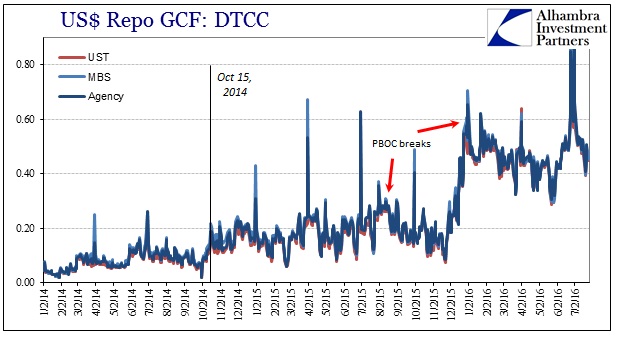
GC repo rates have, by and large, been rising with ramping volatility since that day. What really clinches the systemic change, however, is that the natural hierarchy of money markets flipped at that point. In other words, prior to the 12 minutes of HFT disorder repo rates for the most part respected the risk hierarchy which places unsecured funding (federal funds) activity at a higher risk, therefore interest, than secured funding (repo). The spread between effective federal funds and GC rates was positive as it should be.
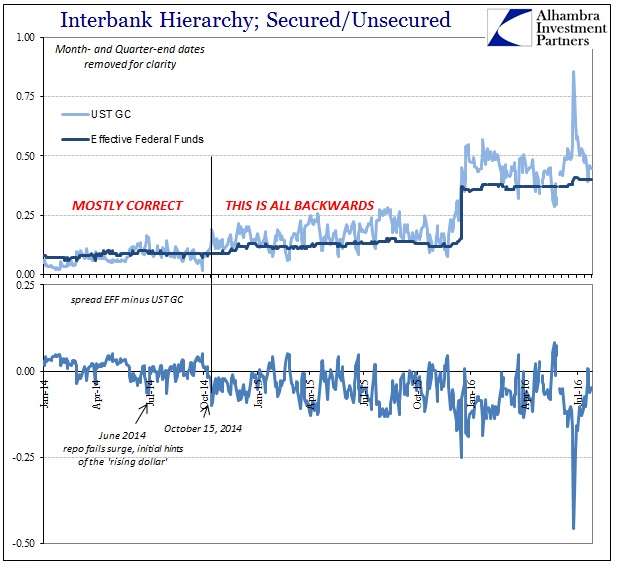
The big exception to the natural order was in later June 2014 coincident to the sudden surge in repo fails – the warning. As repo rates have risen and slipped permanently out of the organic risk paradigm, more irregularity and systemic pressure have appeared which only makes sense. Growing burden typically has a cumulative effect that leads to breaking out in other places. The most obvious in relation to repo mechanics has been collateral hoarding.
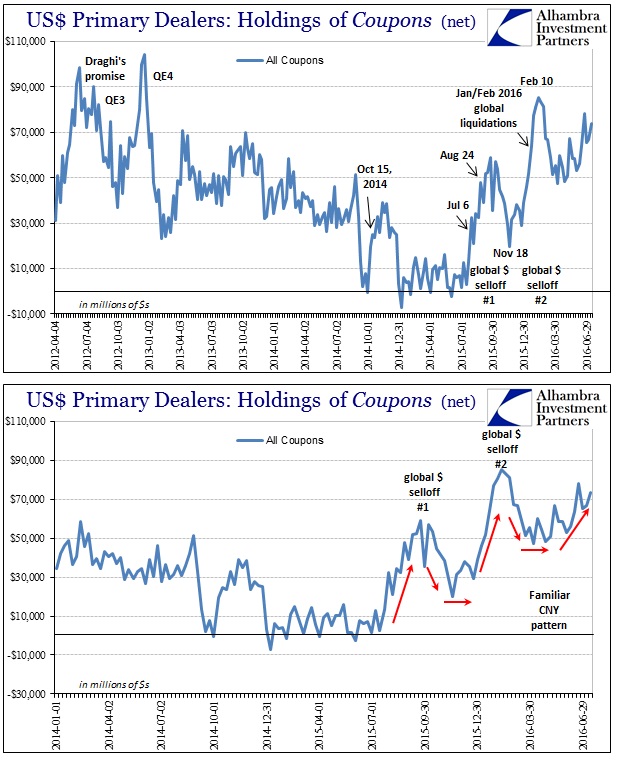
In every major systemic episode since 2007, dealers shift to more positive net UST holdings. The net negative positions from before August 9, 2007, were not related to dealer expectations for interest rates, but instead meant that primary dealer banks were comfortable with their own funding positions to lend out their inventory of UST’s, MBS, or agencies in robust collateral trade markets (leading to factional lending of collateral in rehypothecation; again, “moneylike” behavior). The net positive reports that we see especially since July 2015 correspond with global “dollar” illiquidity, or what has become known as waves of “global turmoil.”
Since the “rising dollar” isn’t always rising in some dollar index or against all currencies, the repo market gives it a visible face. In terms of dealer hoarding of collateral, not only is the level increasing in coupons, it is even sharper and more intense if we add bills.
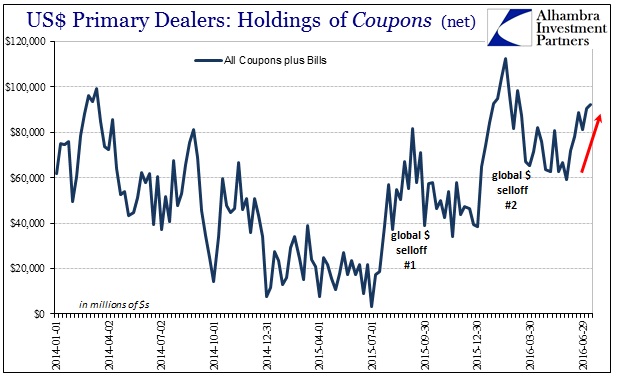
This most recent jump in the overall net “long” of dealer inventory began the week of June 8 – a date we know very well in the one place that is at risk of capturing global asset market attention more than anywhere else.
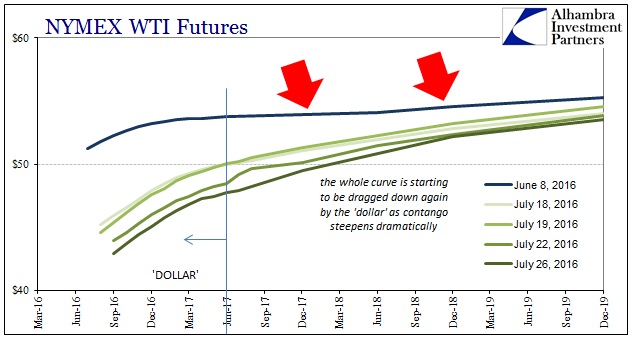
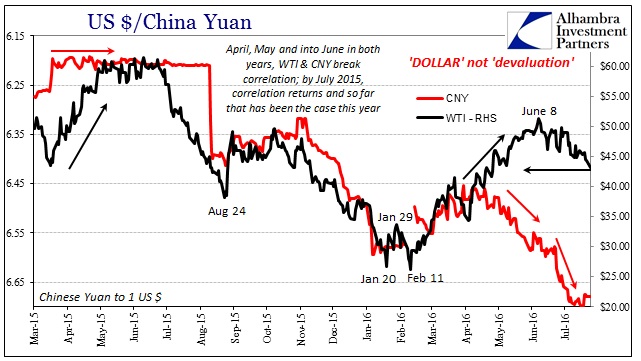
We also find that repo fails are also still elevated as they have been in steady fashion dating back to last August (and the very week when the PBOC broke and was forced to let CNY follow the “dollar”) and then surging still higher in the past few weeks from that point. Total reported fails (both “to receive” and “to deliver”) had been somewhat subdued relative to what had become “normal” over this past year at $170 billion in mid-June, now spiking to $268 billion and $243 billion the past two weeks (the week of July 13, the latest weekly figures).
Altogether, this broad survey of the repo market leads toward two very important interpretations. The first is that where the government and policymakers wrote off October 15, 2014, it was actually the official start of the “rising dollar” period that led directly to the “global turmoil” that shocked and surprised them. It’s easier, perhaps, to suggest that the report itself was intentionally obtuse as a means of trying to enforce calm and impose control, but there is every reason to suspect that economists and policymakers are just so ideologically committed they act so senselessly. They are so blinded by being faithful to orthodox economics, there is a more than reasonable chance they actually believe what was written in that report (which may actually be a worse monetary sin because they have been presented with a mountain of evidence to change their views and still they refuse).
And so the “rising dollar” that became really the systemic baseline that day is, by virtue of the updated repo statistics, clearly still with us and working again toward another bout of “unexpected” recurrences. That is the other major clarification of repo rates, collateral hoarding, and fails (an indirect signal of collateral issues beyond dealers). The implications are more than financial.
Stay In Touch