
The advance estimate for second quarter GDP came in lower than expected. At just 1.211%, the anticipated rebound from the dreadful winter failed to materialize in any significant way. Worse, benchmark revisions now suggest that GDP has been around 1% for three straight quarters; Q4 2015 was revised down from 1.377% to just 0.869%; Q1 2016 was revised back 0.831%.
Most of the benchmark revisions instead focused on seasonality, a particularly troubling result since it can only reduce faith in the statistical processes while at the same time further confirming what we have charged all along – that this economy is very different and thus statistics that were designed for “normal” circumstances are largely inappropriate. Recognizing that they have a very real problem with all this, the BEA now proposes starting 2018 to also publish the unadjusted GDP figures.
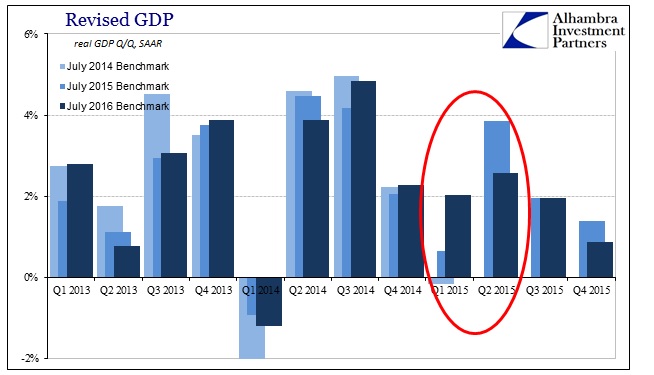
The most visible example of revisions rewriting short-term economic history was the first half of 2015. Under the 2014 benchmarks, Q1 GDP was first estimated to have been +0.2% in the advance release, revised to -0.7% at the second estimate, and then -0.2% for the “final” number. The benchmark revisions in July 2015 added the controversial “residual seasonality” further seasonal adjustment, which brought the GDP rate to +0.6%. In accordance with the new July 2016 benchmarks released today, Q1 2015 GDP is now thought to be +2.0%. That is a significant difference.
To make up for it, however, the BEA appears to have shifted “growth” from Q2. The final estimate under the July 2015 benchmark showed a large rebound to +3.8% from the slightly negative start. At that time, it represented the usual extremes; concerning weakness that was consistent with the uneven trend in GDP giving way to the rapid rebound the mainstream considered the truer representation. What the BEA has done is essentially split the difference; while Q1 was revised up significantly, Q2 was revised down by nearly an equal amount, to 2.6% from 3.8%.
Altogether, H1 2015 doesn’t change. Under the 2015 benchmark where GDP is at extremes, growth in the first half was 2.27% (SAAR). The latest update, which smooths out the jaggedness, shows almost identical growth of 2.33%. This is very concerning and suggests why now all of a sudden the BEA intends to finally display its unadjusted GDP figures after resisting for so long. In other words, they are very clearly attempting to force GDP into a straight line, which is to some extent the purpose of seasonal adjustments all along.
However, by taking extreme measures in order to do so, they operate under the assumption that there is no relevant or significant information contained within that unevenness. This is clearly false (and it recalls the more basic and fundamental objection to statistics in the first place as compared to chaos theory or the unpredictability of complex systems). Steadier growth of 2.33% is not at all the same as highly volatile growth of 2.27%, a fact we can easily observe via other economic accounts that don’t flow into GDP’s statistical soup.
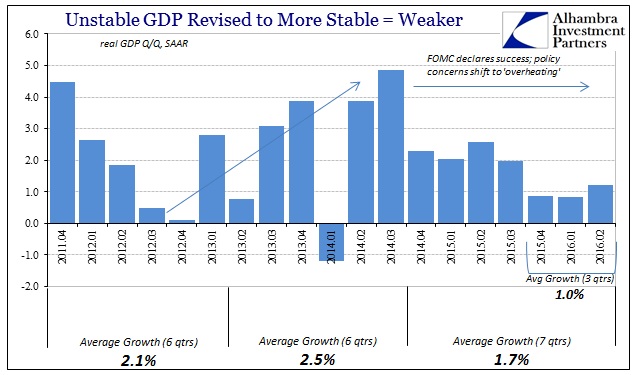
One year prior to all this “residual seasonality”, in the depths of the Polar Vortex of winter 2014, GDP is still figured under the current benchmarks to have been negative. Rather than being a statistical figment, despite what is clearly great effort to make it seem that way, that unevenness served as an important warning that the economy was still not right as economists sought desperately to find the final recovery. It stands out in between the two quarters of seeming better growth before and the two quarters thereafter.
By ignoring the erratic behavior of GDP, economists and policymakers allowed themselves to be fooled by especially the middle part of 2014. The BLS was suggesting the “best jobs market in decades” and GDP, again setting aside Q1 2014 as an “anomaly”, seemed like confirmation. The FOMC even went so far as to declare that economic risks had shifted toward “overheating.”
As you can clearly see on the chart above, it was an absurd proposition based on false assumptions. Rather than race toward recovery take off, the economy instead fell off, now substantially weaker, an outcome that was much more likely taking into account inconsistent GDP where weak quarters were not aberrations. By removing the sharp contrast in Q1 2015 compared to Q2, the BEA is now in danger of creating the same false assumptions about 2015. We have the benefit of the last three quarters to dispel them, but had this new emphasized GDP “seasonality” been applied late last year through the Q3 estimates, it would have appeared as if the economy had slowed only somewhat to a stable condition around 2% from Q4 2014 to Q3 2015.
That is a far different picture than what we actually experienced last year; the dramatic down and then up (and then down again) was an important indication of what was to come because that was what happened in relation to the “dollar”, and the BEA has decided to erase it because straight lines and forcing “normality” are its job under orthodox definitions (cycle most particularly). And if that view had prevailed, policymakers might have felt justified to induce even more harm (which might be giving the federal funds rate and monetary policy too much credit) than they might had already done (instead of one rate hike in December, might they have been emboldened to do more under a steadier GDP paradigm?).
At the very least, it would have made the last three quarters that much more surprising than they already are to economists. Rather than stay steady at around 2%, GDP is now steady at around 1%. Again, that might be overall somewhat accurate as to what happened, but it removes all the interesting and relevant behavior of how it got that way; the new benchmark estimates do show the economy getting worse right after “global turmoil” hit last summer during Q3, but to suggest an orderly slowing or gentle downshift is to intentionally exclude important granularity. We will never know, but what would Q1 2016 GDP look like under the “seasonality” of the 2014 benchmarks? As bad as +0.831% is, it is very likely to have been much worse without the straight lines of late which would have been far more consistent with especially January and February during the liquidations.
What we are seeing is an economy unlike anything before, and to try to shoehorn it into prior concepts of “normality” risks degrading even further our ability to interpret data as a more consistent and applicable form of analysis. As it is already, the fuller view of this lack of recovery has only been confirmed by benchmark revisions elsewhere that show that economists and policymakers had indeed made 2014 their mountain of a molehill. In more relevant, wider context, it never really computed as anything other than the same disaster.
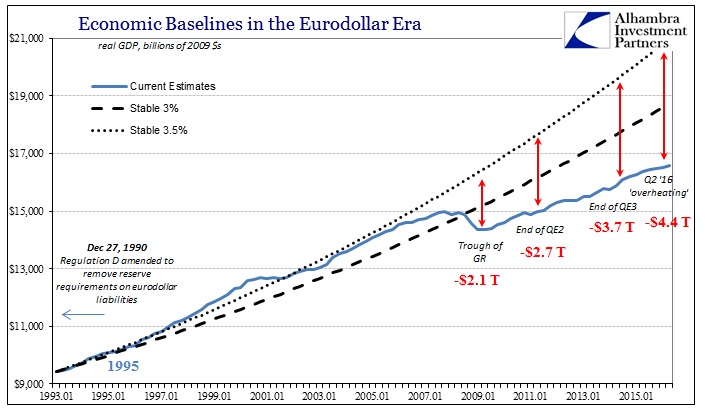
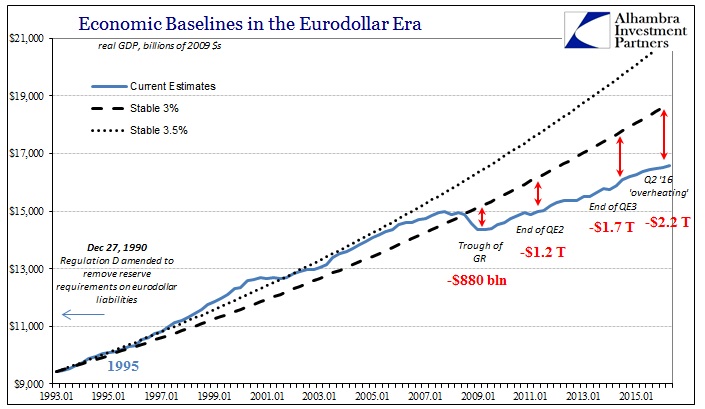
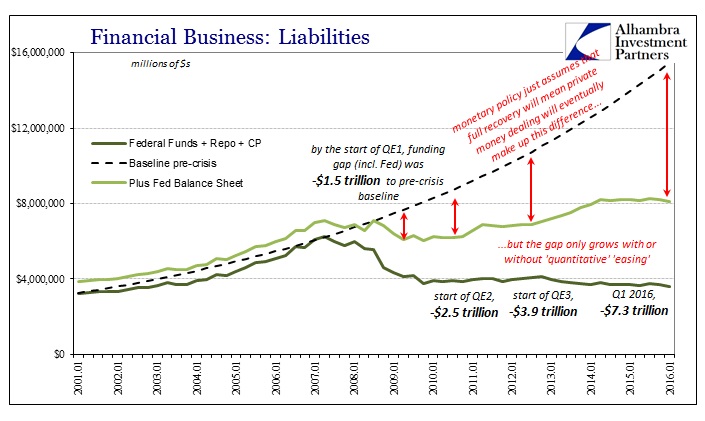
No matter how much QE or balance sheet expansion or “accommodation”, the economy as viewed by GDP and its unevenness only fell and still gets further and further behind. Not only has it never closed the recession gap left after the Great Recession (indicating once more that it wasn’t ever a recession), that breach has only expanded in the years since (it doesn’t matter which baseline you use to measure; see below). Smoothing out GDP risks misconception because it takes away the erratic nature that suggested the chart above in favor of the binary, linear concept of recession/not recession that is an immaterial distraction.
The US economy is in serious, long-term trouble. We knew that very well by the volatile nature of GDP almost from the start (the big negative in Q1 2011, for example). Because orthodox economics is entirely obsessed with the economy that “should be”, it favors smoothing out what is truly pertinent texture because it isn’t directly cyclical by implication. What the mainstream needs is not to try to turn statistics into “ideal” numbers, but to actually see them for what they represent especially when they stray into unexpected ranges. From that perspective, weak quarters were not “anomalies” to be dismissed in a fit of confirmation bias, but rather warnings that actually explain how we got here and why everything from economists, especially “overheating”, was unlikely from the start.
Stay In Touch