
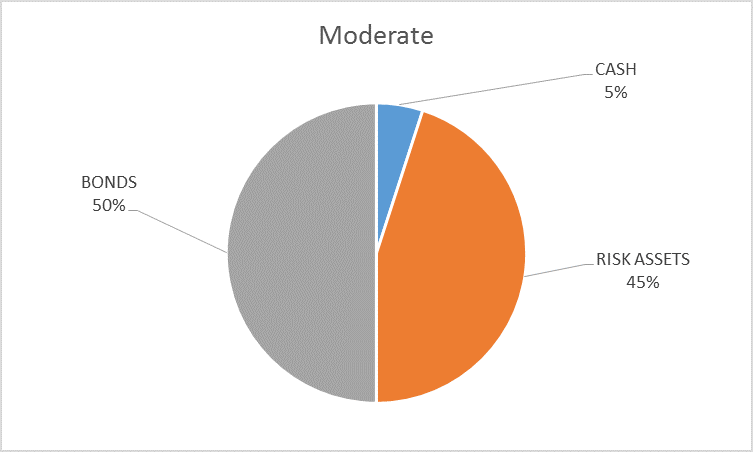
I’ve put off this update as long as I can now, waiting for some clarity, a change in our indicators that might suggest a change to the portfolio. Alas, despite a Fed meeting, a BOJ meeting and a plethora of economic data nothing has moved sufficiently to warrant a change. The risk budget is unchanged this month as is the entire portfolio. For the moderate risk investor, the allocation between bonds, risk assets and cash remains at 50/45/5. Credit spreads did narrow a tiny bit, the recent trend intact. But it wasn’t enough to warrant using our unusual 5% cash position. The yield curve steepened by all of 3 basis points, again not enough to justify any kind of move. Short term momentum for stocks is now negative and long term momentum remains that way. Valuations for US stocks continue to worsen as earnings and margins continue to decline.
With essentially no change in our indicators, I cannot justify making any kind of move. The economic data continues to deteriorate ever so slowly; August was a particularly bad month for the economy. The Chicago Fed National Activity Index fell back into negative territory, the ISM indices turned lower, the LEI was negative, the regional Fed surveys were generally negative (especially the details), retail sales are still decelerating (even non store retailers – internet – were down in the latest report) and industrial production accelerated…to the downside. That’s not a complete list (the bi-weekly economic review is next week) but it was just an awful month for the economy. And, oh yes, we have an election in less than two months, a Hobson’s choice where none of the above would probably be the best outcome.
Indicator Review
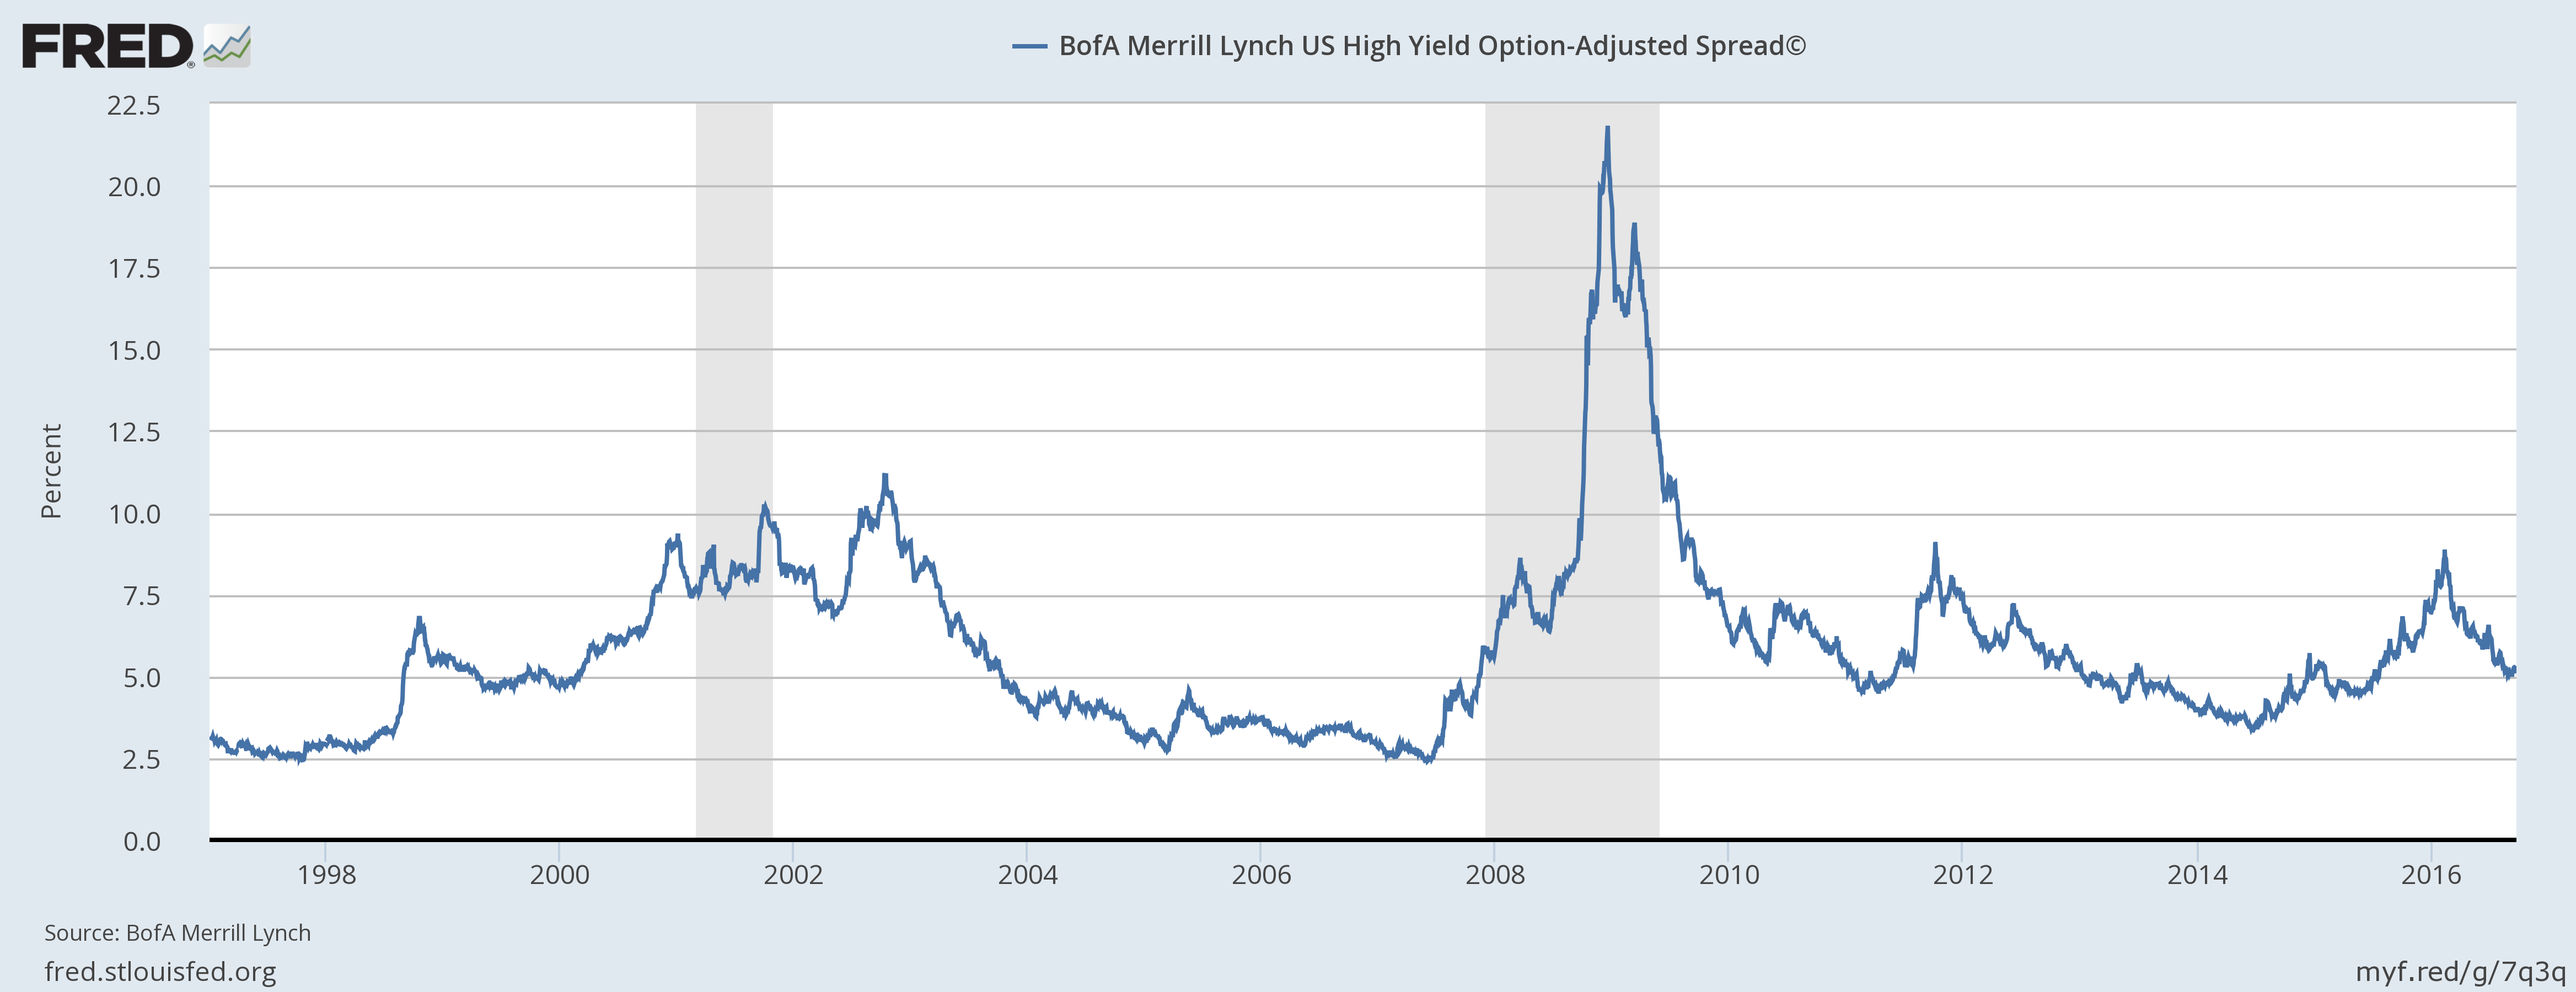
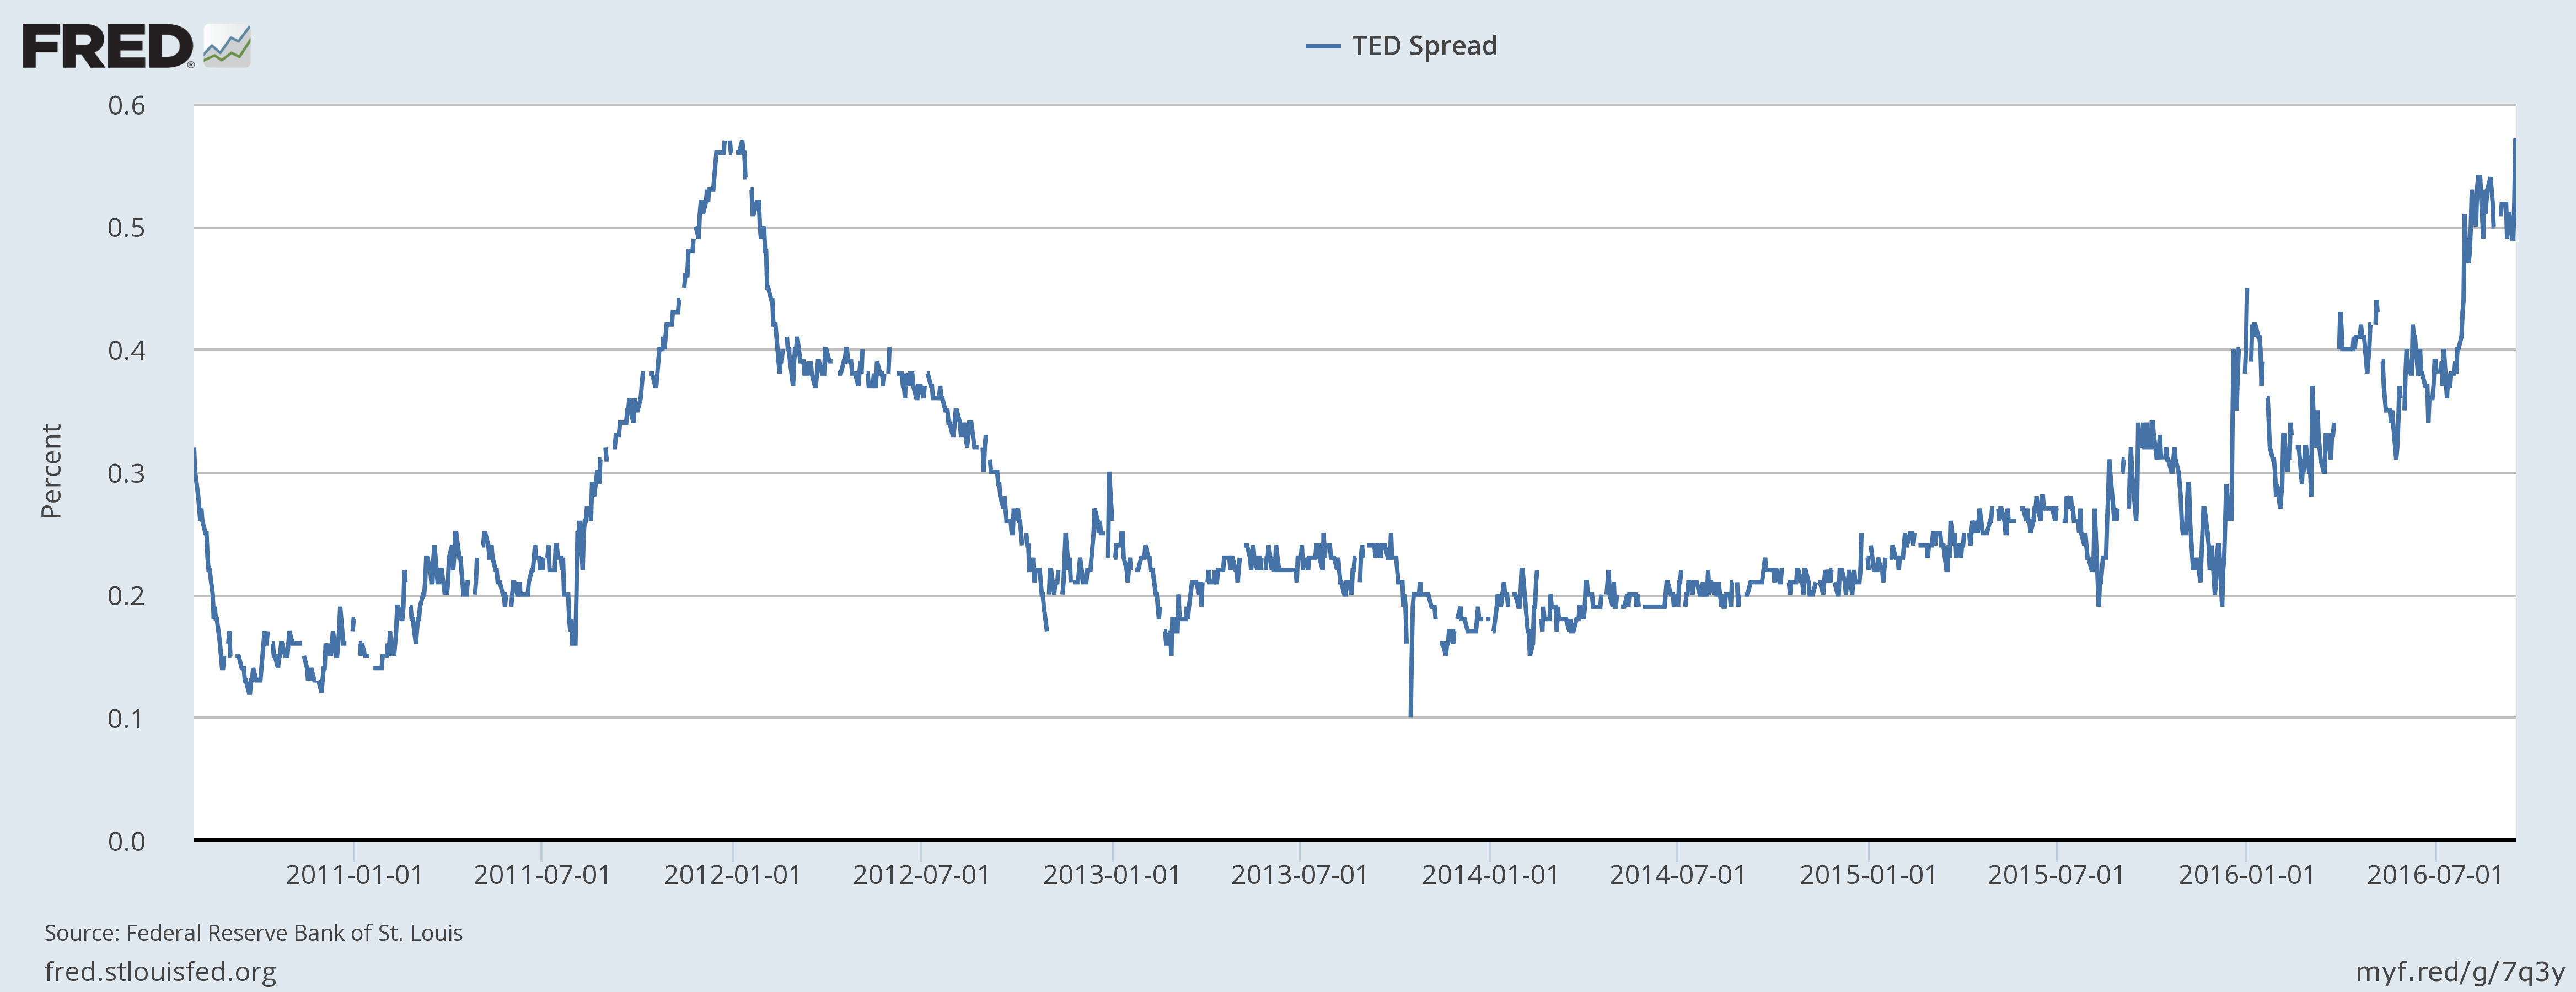
- Credit Spreads: As I said, credit spreads did narrow ever so slightly so that trend is intact if a bit stalled. As I’ve pointed out before though, high yield spreads are still well above the lows of this cycle and last. And as I wrote about last month, the TED spread continues to worry moving wider again last month. The consensus remains that this is a result of the coming money market changes but I feel it is prudent to wait and see how the spread acts after the changes are implemented. If it narrows immediately after then, fine, it was just due to the regulatory changes. But if it doesn’t, then there must be something else going on. No matter the cause, the widening TED spread has consequences today no matter why it widens.
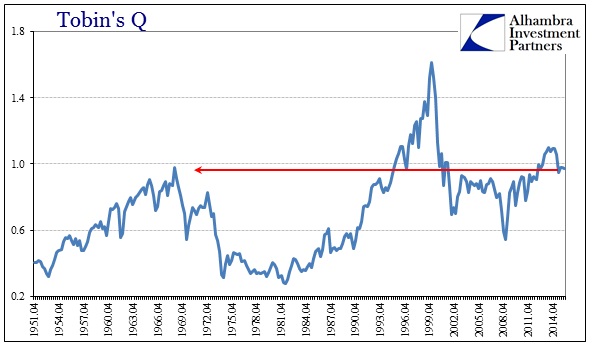
- Valuations: With all Q2 numbers in the S&P 500 earnings totaled $23.28, down significantly from the initial estimates of over $26. That’s about 2% above the year ago number. Trailing 4 quarter earnings are just $87.73 and a long way from where we would be if the economy was really doing as well as the Fed thought. Shiller P/E is now 27, a number that was last exceeded in mid-2007. Jeff has an update on Tobin’s Q here. I won’t bore you with all the methods that show this market to be expensive. Here are all the methods that show the market to be cheap: _____________________.
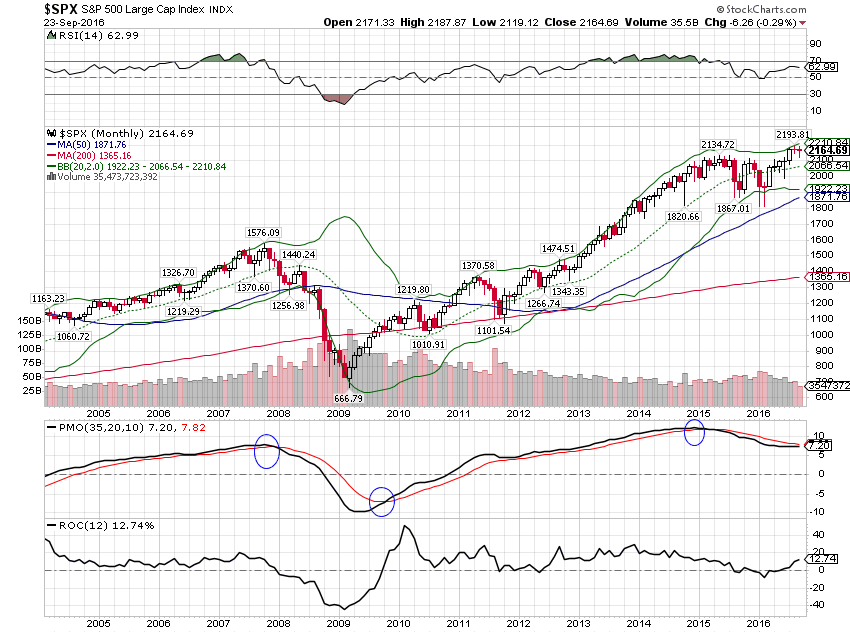
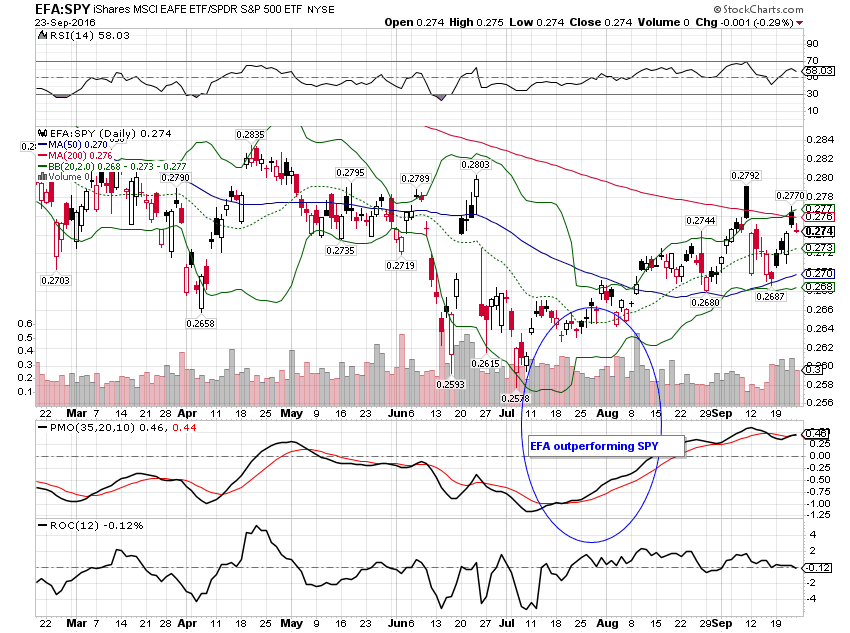
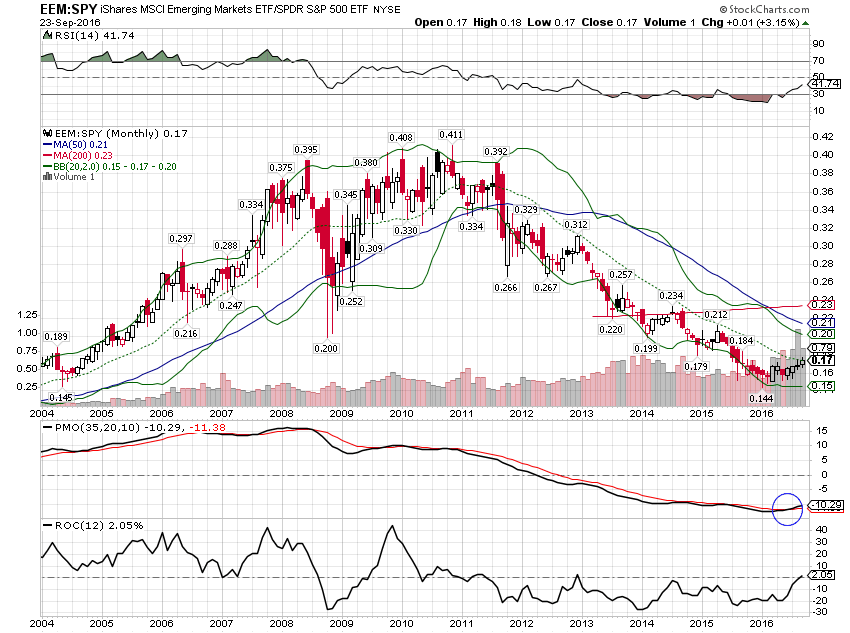
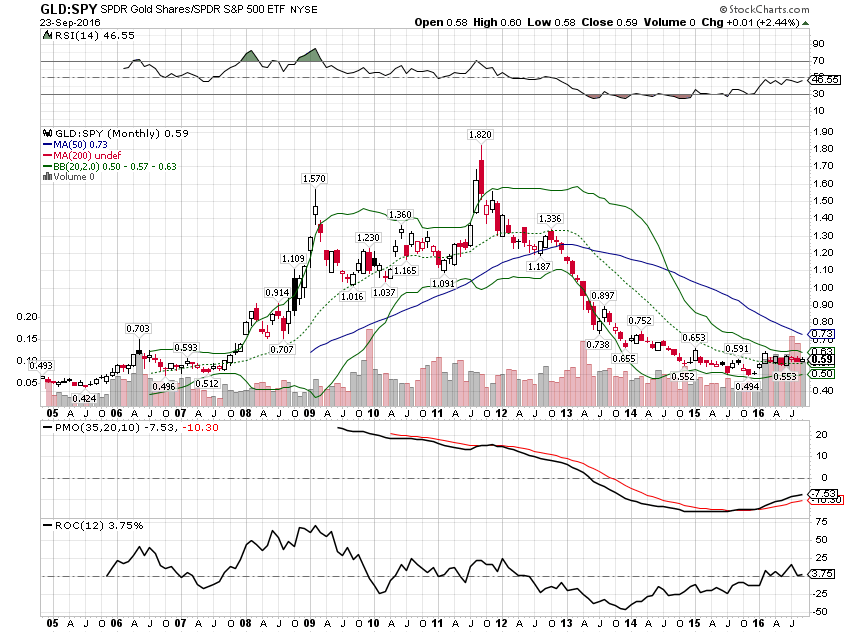
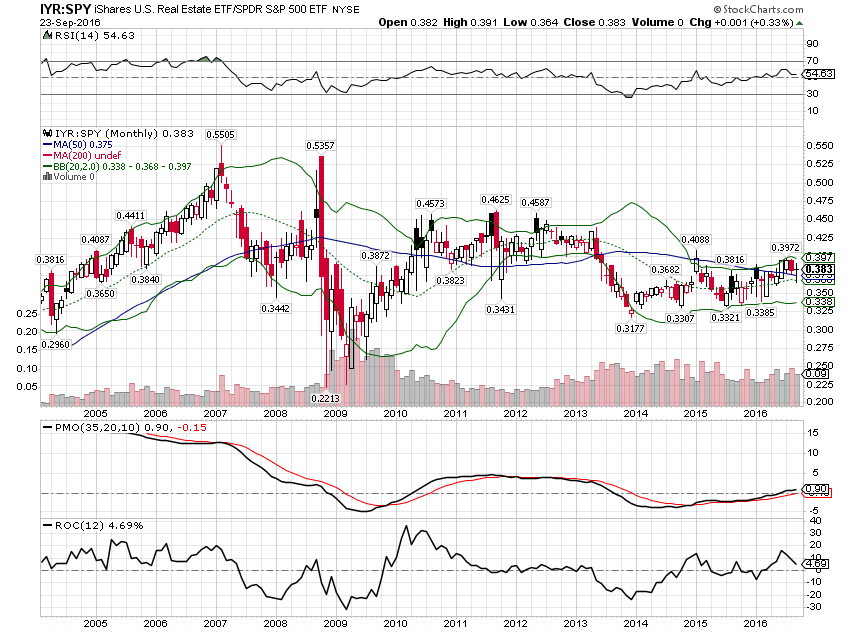
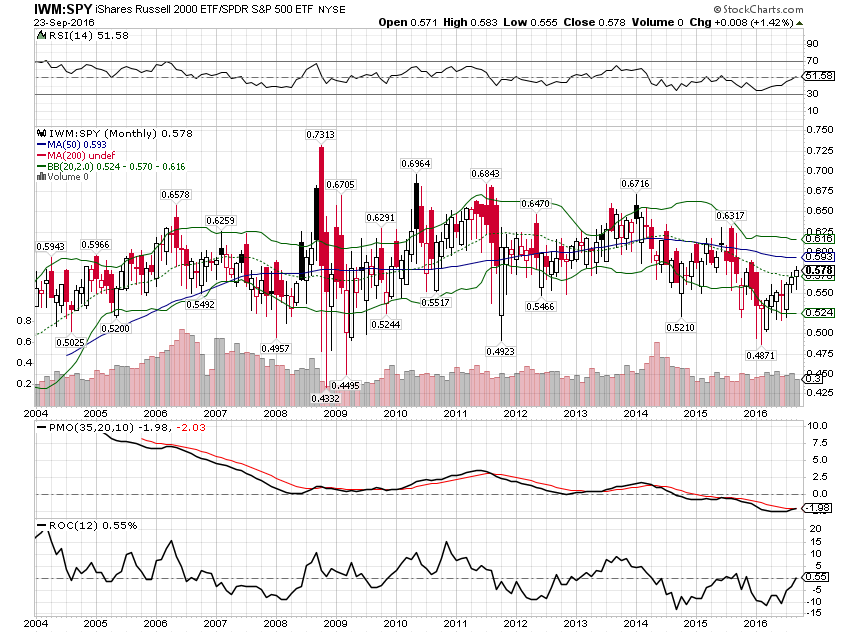
- Momentum: Short term momentum for the S&P 500 has turned negative and long term momentum has never wavered from its sell signal despite nominal new highs. Momentum continues to favor EAFE and EM short term. A momentum buy signal for EM versus S&P has been triggered but EAFE has yet to generate sufficient upside to do the same. Commodities and gold continue to enjoy positive momentum relative to the S&P 500 as well. Long term momentum also continues to favor intermediate Treasuries versus the S&P 500 although that trend is starting to look shaky. Real estate is still favored long term although international has turned lower short term. Lastly, small caps have outperformed large short term but the long term trend still favors large caps.

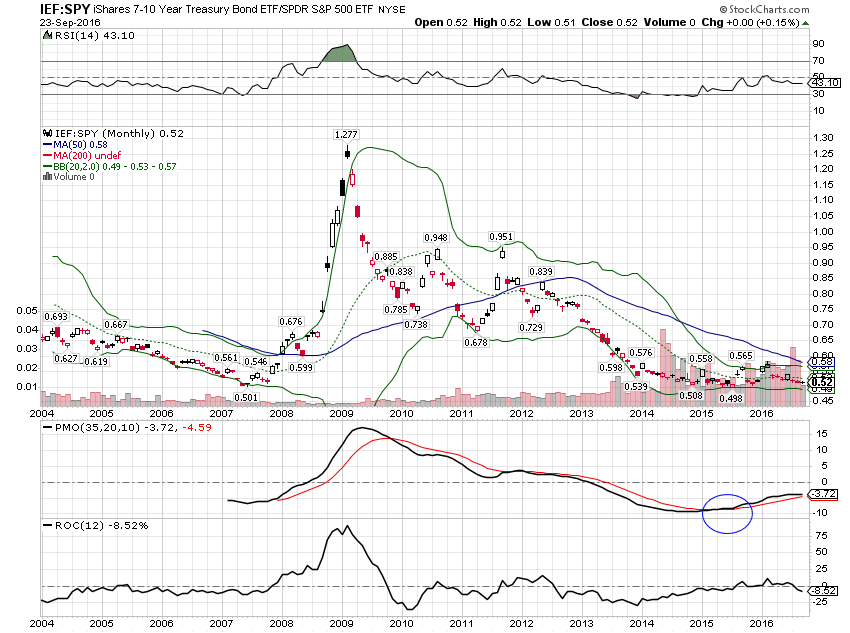
- Yield Curve: The 10/2 spread steepened slightly but the trend is still toward flatter. Frankly, that might be the more benign outcome. If the economic data continues to get worse the yield curve may steepen as short rates collapse again. That is generally what happens right before recession but I’ll be the first to admit that I have no idea if that will happen in this cycle with rates so low already. In any case, the yield on the 2 year Treasury peaked last December and has generally trended lower this year, just not as rapidly as the 10 year.


Other Indications
Inflation expectations actually rose by 10 basis points:
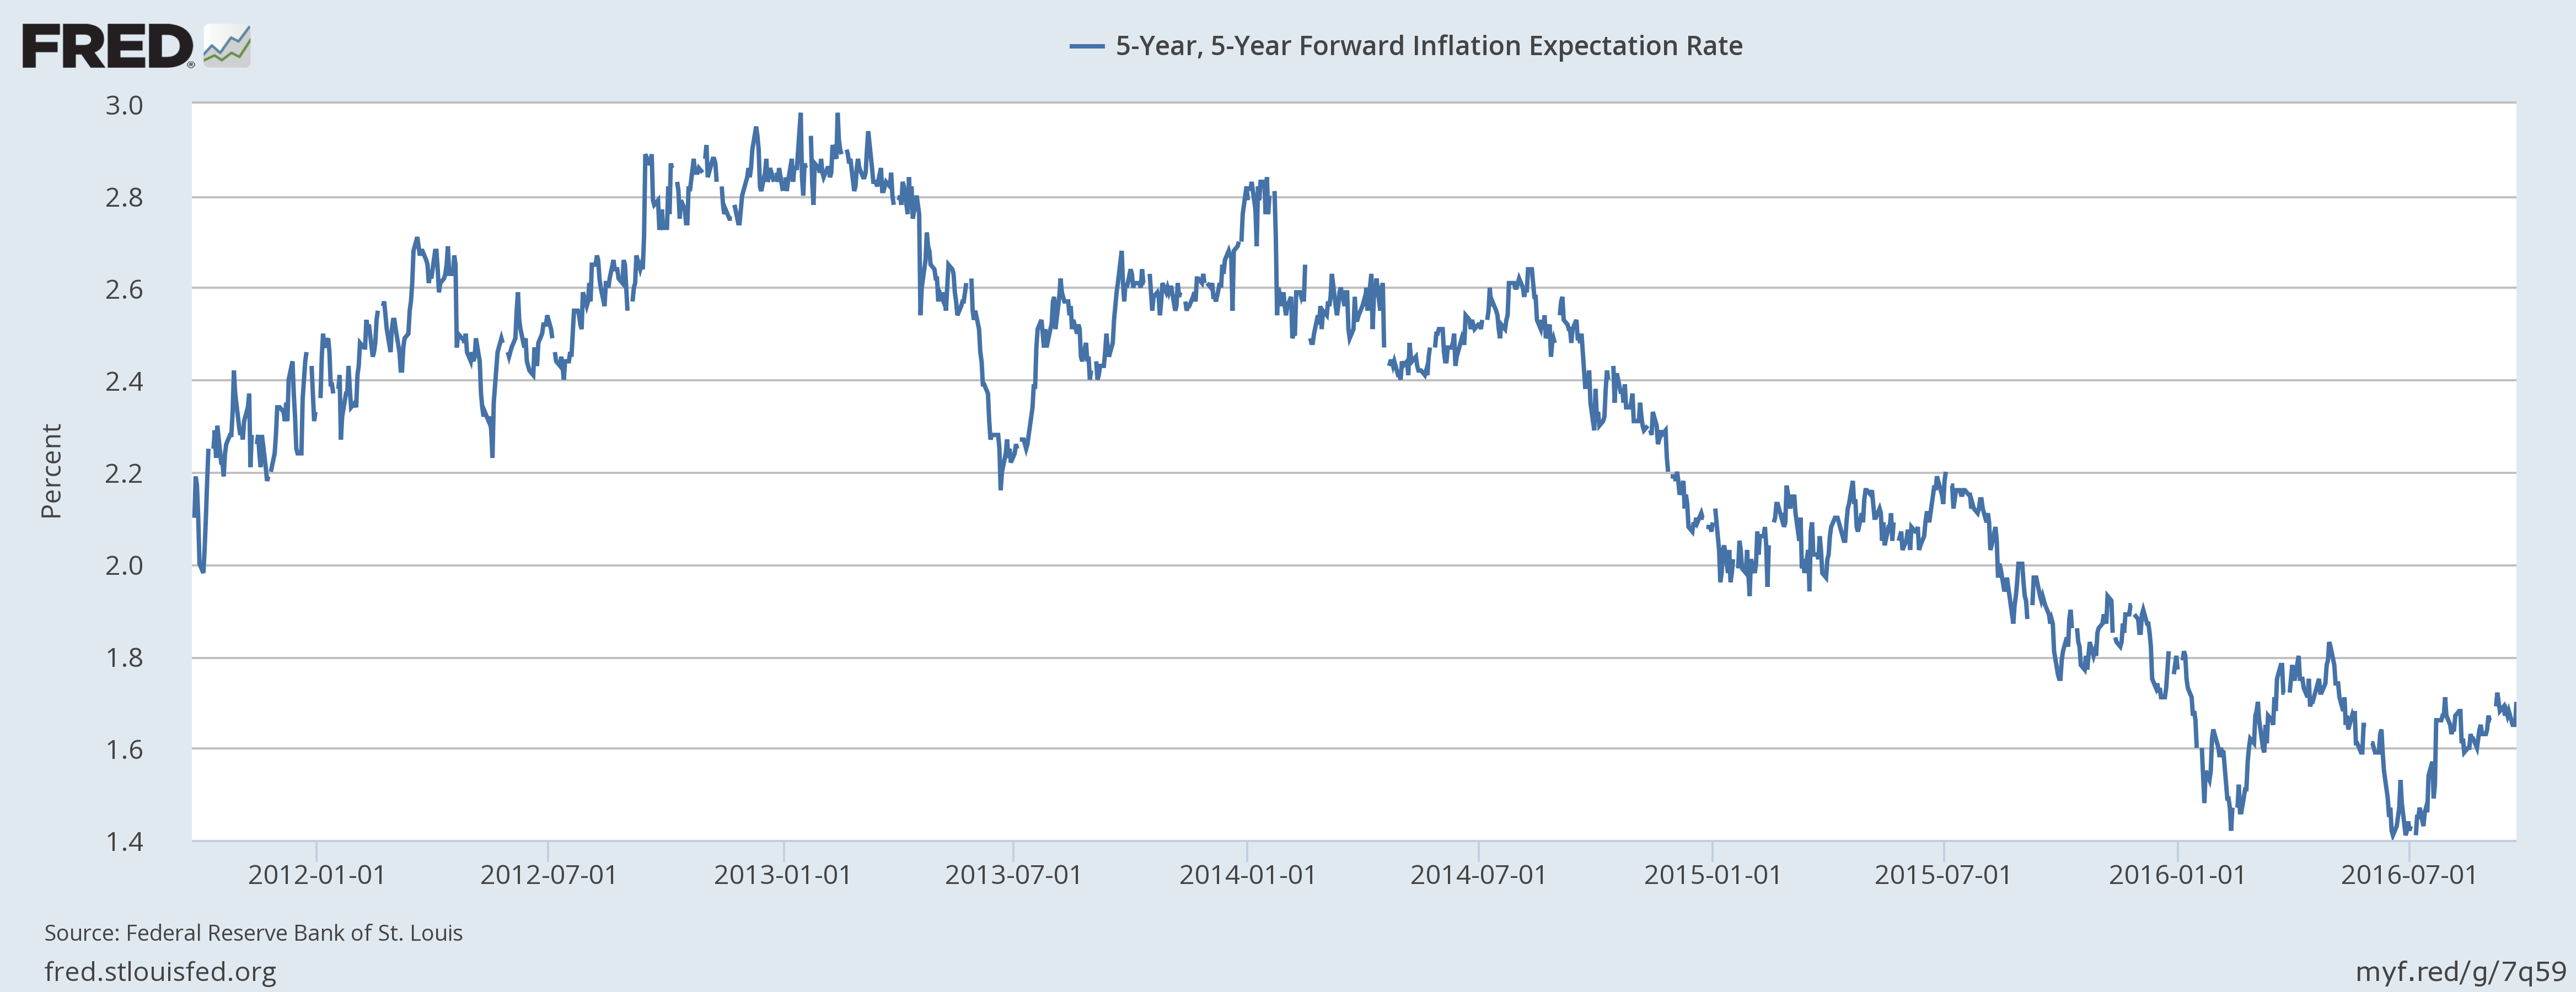
As TIPS yields started to fall again, an indication of falling real growth expectations:

The Dollar index was up slightly since the last update but we’re still stuck in the range we’ve been in for the last 17 months:

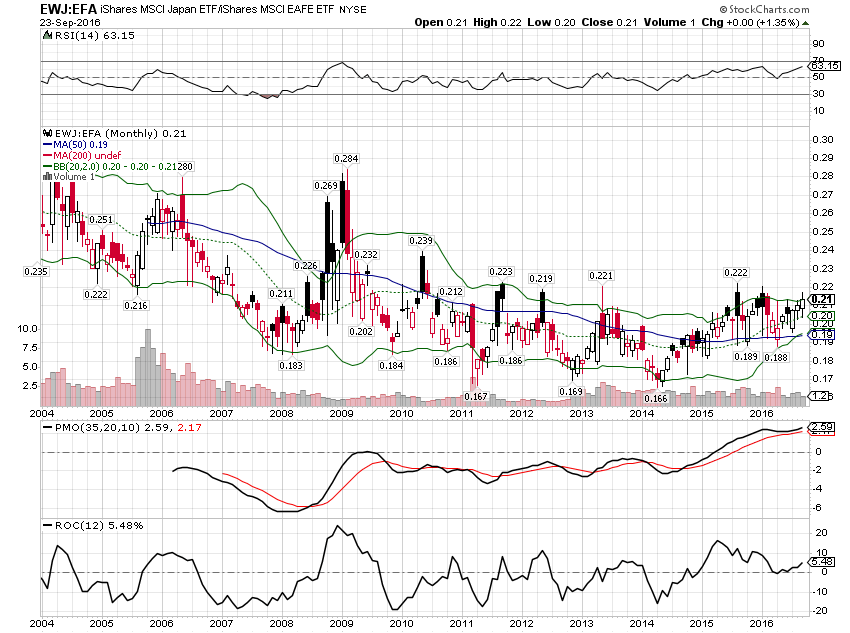
Japan continues to outperform EAFE as it has since early 2014
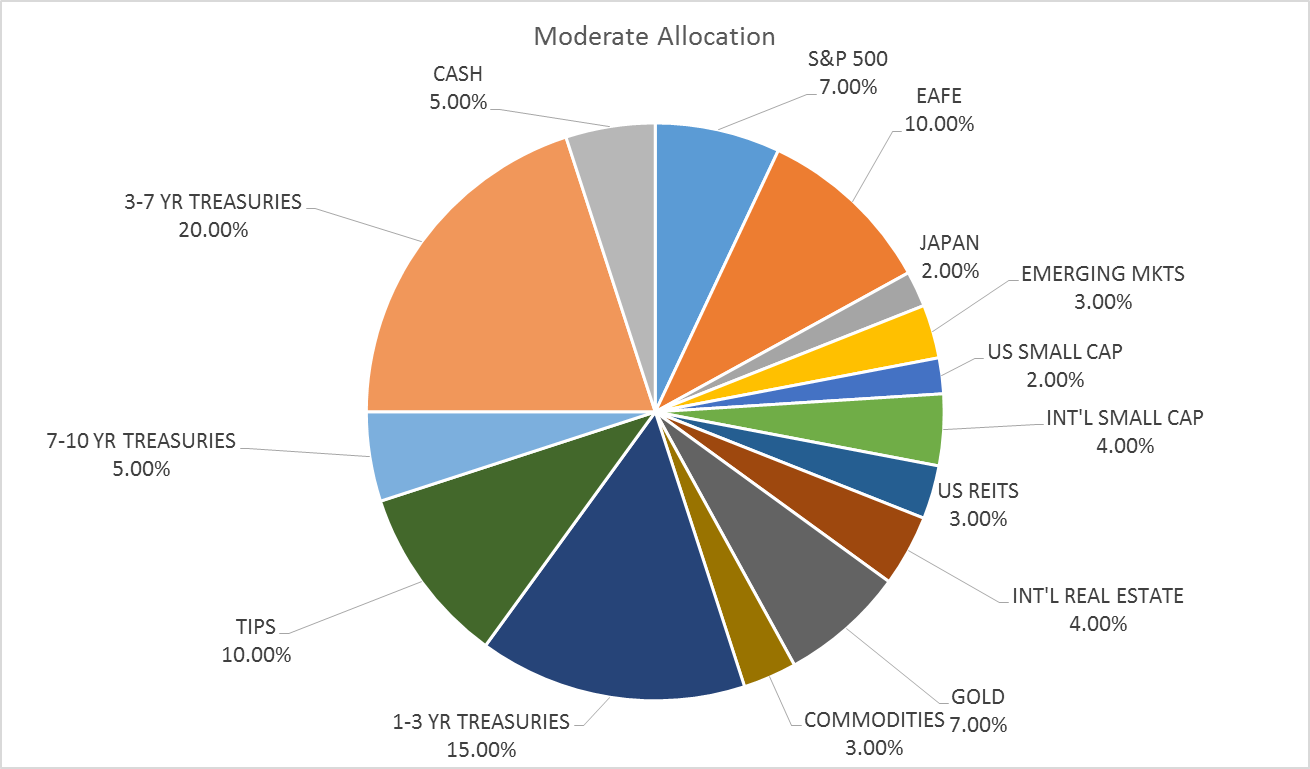
The right answer to the question, what should I do with my portfolio?, is most often, nothing. And that is what we do this month, the moderate allocation the same as last month:
FOR INFORMATION ABOUT OTHER RISK BASED ASSET ALLOCATIONS OR ANY OF OUR OTHER TACTICAL MODELS, PLEASE CONTACT JOE CALHOUN AT JYC3@ALHAMBRAPARTNERS.COM OR 786-249-3773. YOU CAN ALSO BOOK AN APPOINTMENT USING OUR CONTACT FORM.
CLICK HERE TO SIGN UP FOR OUR FREE WEEKLY E-NEWSLETTER.
“Wealth preservation and accumulation through thoughtful investing.”
This material has been distributed for informational purposes only. It is the opinion of the author and should not be considered as investment advice or a recommendation of any particular security, strategy, or investment product. Investments involve risk and you can lose money. Past investing and economic performance is not indicative of future performance. Alhambra Investment Partners, LLC expressly disclaims all liability in respect to actions taken based on all of the information in this writing. If an investor does not understand the risks associated with certain securities, he/she should seek the advice of an independent adviser.
Stay In Touch