
Dating all the way back to February 11 and the Chinese turn on the “dollar”, the eurodollar futures curve had been stuck in a relatively narrow range. That trading band was widened a bit in June before and after Brexit (related to CNY’s regular mid-year drop), with futures on the whole curve bid up to early July and then slightly sold after the BoJ’s “helicopter” rumors. The sideways action was finally broken in early November just prior to the election with the selling and steepening along with the bond market “reflation” optimism.
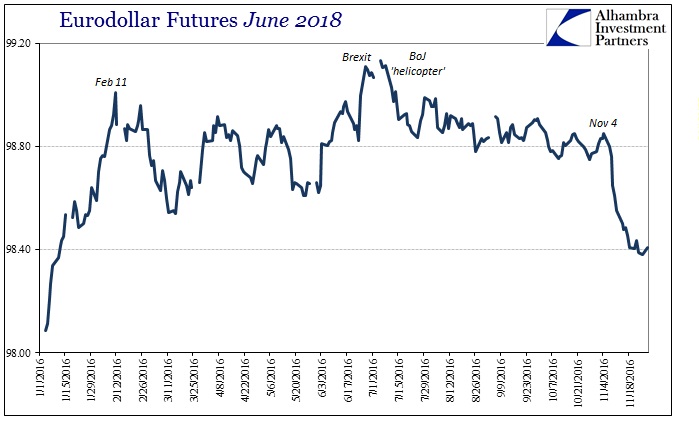
The total move at the June 2018 contract was about 40 bps since November 4, which seems impressive if only in the context of the narrow trading this year. That would at least to be keeping with the spirit of optimism that has prevailed throughout much of the past few months, as markets begin to price the possibility of something different being something to some degree more effective. Though these same market participants don’t likely know what that different will mean nor the details about it, it’s all just guessing at this point, it’s a chance and given the pessimism that permeated so much of credit and rate markets this summer some retracement was overdue.
The question is the context of that retracement as a comparison to similar changes in the past. Where reflation is being talked about in exaggerated fashion right now, in truth what we see in markets we have seen before in these very same markets. In eurodollar futures specifically, the last big move down (in price) was last November/December coincident to the Fed’s (so far) only “rate hike.”
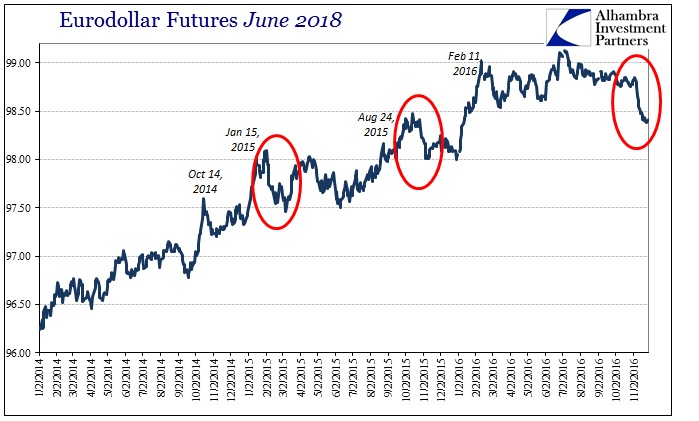
The eurodollar market also followed a similarly optimistic path in early 2015, with many other markets trying to guess that Janet Yellen’s “transitory” declaration might prove similarly different so as to be a consideration. Both of those moves were of similar proportion to the current hype of November “different has got to be better.”
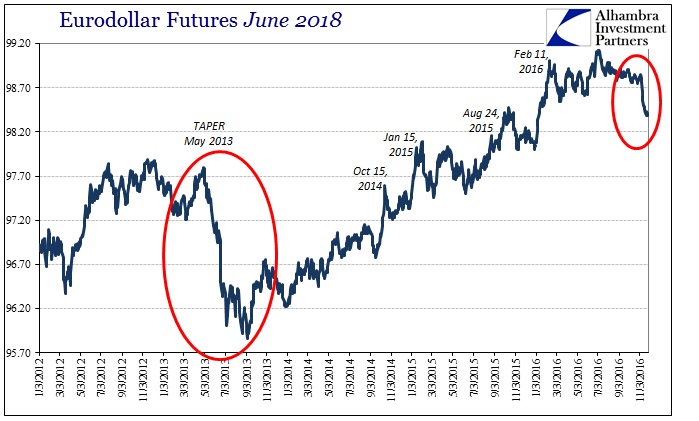
Of course, the standard for reflation positivity has to be the summer of 2013. In eurodollar futures, taper meant selling from May 2013 to September 5 that year – just prior to the FOMC chickening out the first time (“everyone” expected a vote on taper at the September 2013 but were disappointed and forced to wait a few months so as “overseas turmoil” would pass, at least in the mainstream estimation of it). Compared to 2013, there is little to be excited about.
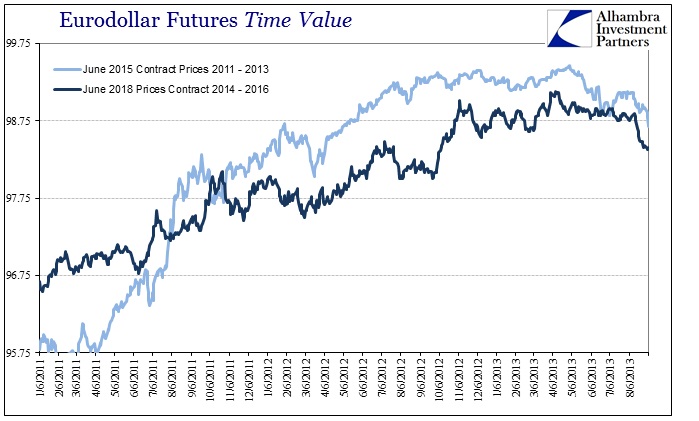
We do have to be careful, however, to take account of time. As futures contracts draw closer to maturity, as calendar rolls pull each tenor forward in the curve as it moves through time, there is much less volatility and movement that comes with transitioning from medium to short-term money. With that in mind, a better comparison might be the June 2015 contract as it priced the taper summer selloff of 2013.
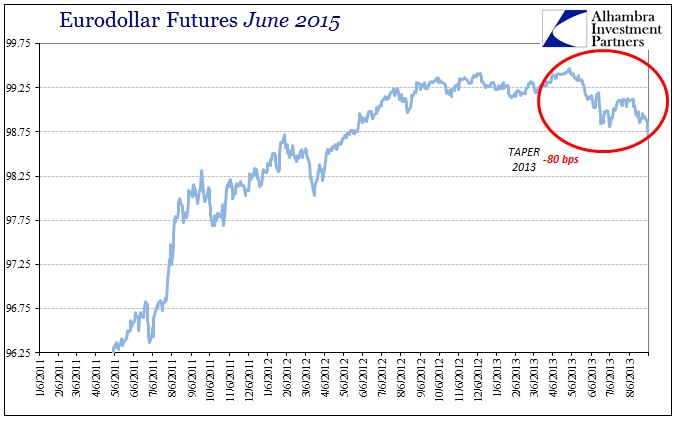
The proportions are similar, but still that burst of “reflation” on a similar part of the curve back then was about twice the depth of what we have seen since November 4, and a third more than the total selloff going back to July 2016 and the BoJ.
We should also keep in mind how much more violent the money markets were shaken in 2011 and into 2012 as compared to 2014, 2015, and the start of 2016. Overall, there was a greater tendency to redraw these sorts of distinctions; by that I mean there was far, far more optimism stamped out of the eurodollar curve, as the UST or other bond curves, in the 2011 crisis all the way to QE3 in the US, meaning that we aren’t strictly comparing apples to apples in this way, either.
We can’t just dismiss the level of pessimism that suddenly appeared and then persisted for so many years interrupted only in spurts going back to early 2011 and what was supposed to be the recovery. That may be the most apt benchmark for comparison, as to what recovery was supposed to look like coming out of the Great “Recession.”
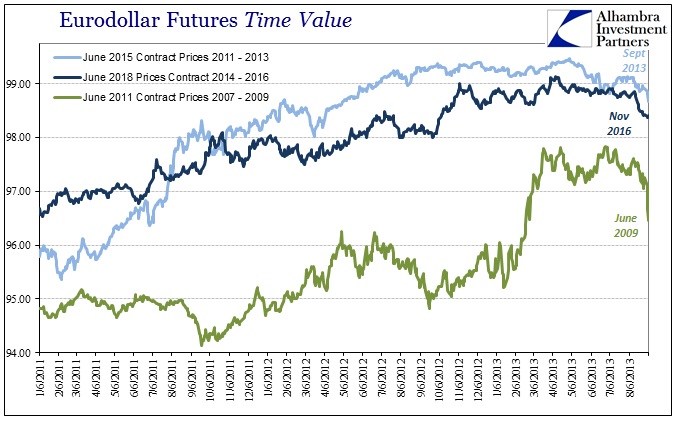
In the first place, the “recovery” indicated by eurodollar futures only lasted until early June 2009; it didn’t even make it out of the Great “Recession” itself before the whole curve was drastically bid again warning (those paying attention) that a great deal was not set right (money as well as economy) no matter what QE1 and ZIRP were supposed to accomplish. That proved to be the case only a few months later in late 2009 as rumors swirled about Middle Eastern banks and then full attention to start 2010 on Greece.
In terms of recovery expectations, however, the standard isn’t just to change from one low level (high price) to another less low level (slightly less high price), rather it is for the whole curve to indicate normalization potential across-the-board. Even the Federal Reserve doesn’t believe in that scenario anymore, all but admitting that whatever “recovery” they are now forced to envision is far different than the one they have been promising and even claiming they saw just over the horizon. Even the 2014 “overheating” scenario is dead. The best case for monetary policy in the Fed’s models seems to be where the federal funds rate might in a few more years get back to 3%.
Again, that is a position that the eurodollar curve staked out years ago, all the way back to 2011, only to be dismissed time and again by economists fixated on the unemployment rate; and not even the unemployment rate, per se, but more what they thought that statistic might tell them about the economy just over that mythical horizon.
By that perspective, the possible “reflation” of 2016 is a far different set of circumstances than what it is being taken for. Markets, as is usually the case, tend to get overdone in either direction, but commentary about those extreme moves is at this time far further out of alignment than at any point since perhaps 2009. Again, I think it goes back to these markets pricing a range of scenarios for the intermediate term that are just a little less bad than they were in the summer before the BoJ; but still very, very different than recovery. But that isn’t what is being written about all of it, as the media is once more engrossed in full recovery as a narrative.
A true return to happier times would mean the June 2018 contract trading 95.40, not 98.40. Again, even the Fed has admitted to the large degree of difference, though they clearly still have no idea why. There is no actual recovery indicated in this “reflation” potential, meaning, in yet another case, a word being used for circumstances that a few years ago would have meant no possible way for that word to apply; another case of interpreting prices by incorrectly using the vocabulary of the business cycle.
Stay In Touch