
Then-Federal Reserve Chairman Ben Bernanke testified before Congress on May 22, 2013, that taper was for officials a strong consideration. Though QE4, the UST portion of the restored balance sheet expansion, wasn’t yet six months old and he had promised, sort of, at the start of QE3 that both would be open-ended, sort of, his message to the legislature was sufficiently positive that the FOMC’s intent was very clear. His reasoning was also quite clear, as Bernanke explained:
If we see continued improvement, and we have confidence that that is going to be sustained, in the next few meetings we could take a step down in our pace of purchases.
This wasn’t a surprise, however, as the word “taper” itself had already entered the market lexicon weeks before. On May 11, the Jon Hilsenrath wrote in the Wall Street Journal that officials had already “mapped out a strategy for winding down an unprecedented $85-billion-a-month bond buying program…” At that time, they wanted to be careful so as not to provoke too strong a reaction. As Bernanke told Congress, there were risks to rates rising too fast and unevenly.
The WSJ article was written in response to rumors already palpable in the UST market, MBS market, and other places like eurodollar futures. All of them reversed in unison on May 2, 2013. What was uncertain to Fed officials was when to start; what didn’t matter to markets was that timing. If the economy was as strong as was being claimed, then the timing of tapering QE purchases was itself irrelevant.
The bond selloff was strongest in mid-June, with the most violent direct liquidations roiling the MBS market in the days following Bernanke’s June 19 press conference. There he said, “[T]he Committee currently anticipates that it would be appropriate to moderate the monthly pace of purchases later this year.”
The most direct portion of the bond market selloff, the true sustained selling, in this case meaning UST’s, lasted about 126 days. The long bond’s drop (in price) was in this stage merely 111 days, as the yield reached a high in late August. Almost everything else ceased the immediate downtrend on September 5, 2013. Fed officials had backtracked somewhat over the summer, and by late August there was concern that the economy might not have been so robust that year (and then some). The softening was more or less confirmed later that September when despite all earlier predictions the Fed held steady at their policy meeting that month and remained on taper hold until December.
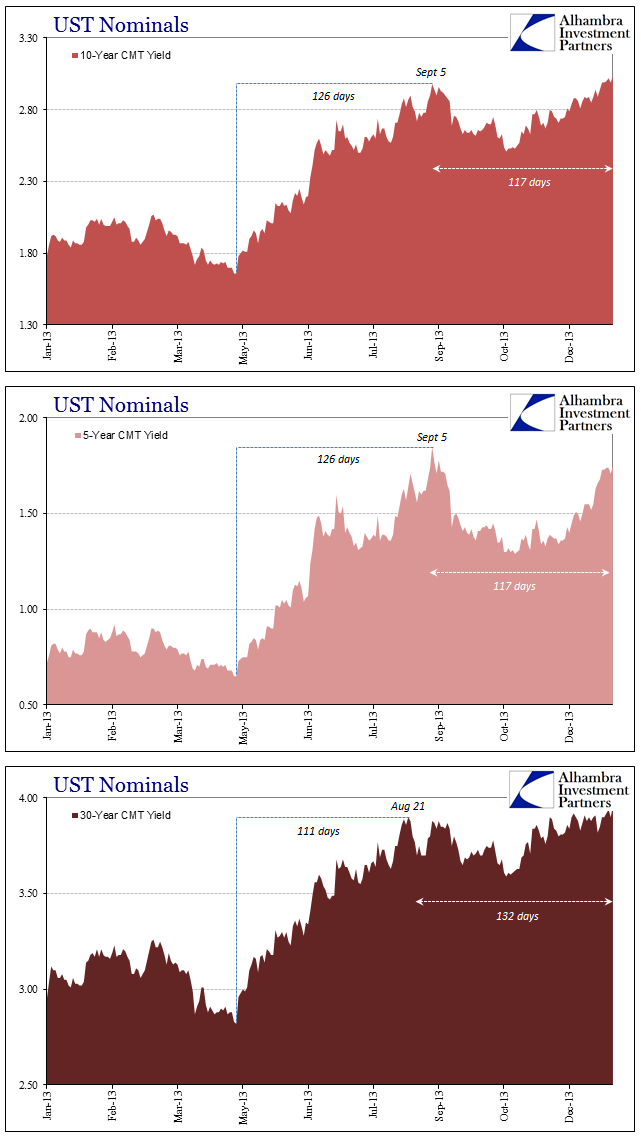
The Fed’s lack of confidence, as well as the economic concerns that condition arose from, essential split the “reflation” trade in 2013. Markets and the mainstream struggled with the sudden and alarming currency crises that “unexpectedly” appeared coincident to all this, making the second part much less forthright. After the initial selloff, there was a pause in it such that the overall peak in UST yields would not be reached until the very end of 2013 (and additional 117 days).
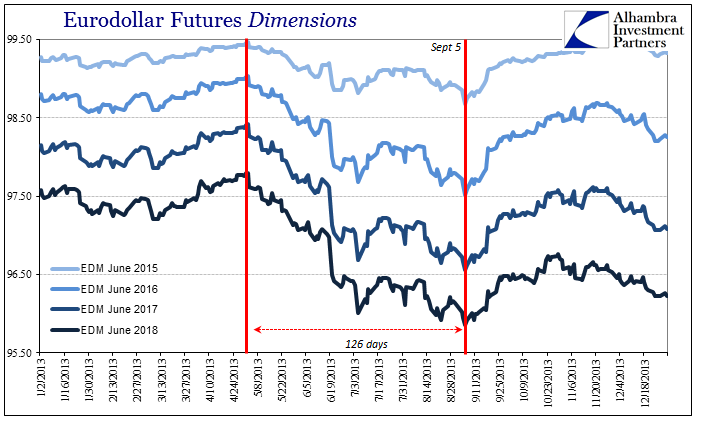
Eurodollar futures, on the other hand, did not follow the general UST market in that second stage; September 5 was the ultimate end of “reflation” for these crucial derivatives. From that point forward, eurodollar futures would signal considerable and growing trouble for nearly three years more.
In terms of time, the current “reflation” trend is already of similar proportions to that of 2013, even though in terms of scale it is significantly less. Obviously, we don’t have any idea the ultimate end or even if it will end, but it is quite significant that everything changed (bearish, meaning against “reflation”) on December 15, 2016. Like September 5, 2013, the day after the FOMC’s “rate hike” was a literal inflection in almost every important indication related to the “dollar.” The change is significant not just because it is found across such a broad survey, but also because all these are now moving once again in the “wrong” direction.
Starting with eurodollar futures, the curve has shrunken again quite noticeably in much the same way as it did in September 2013.
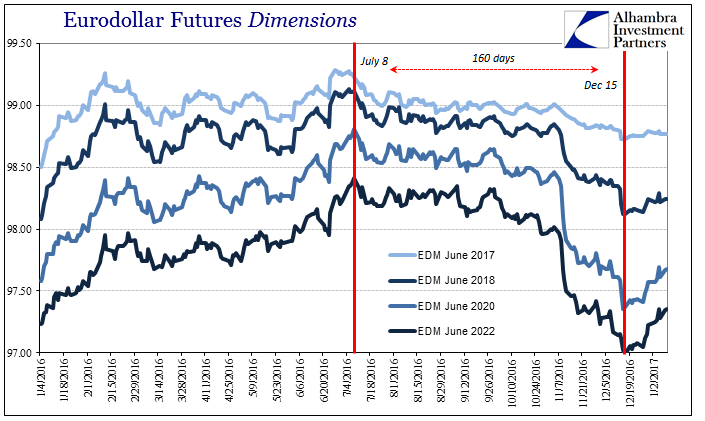
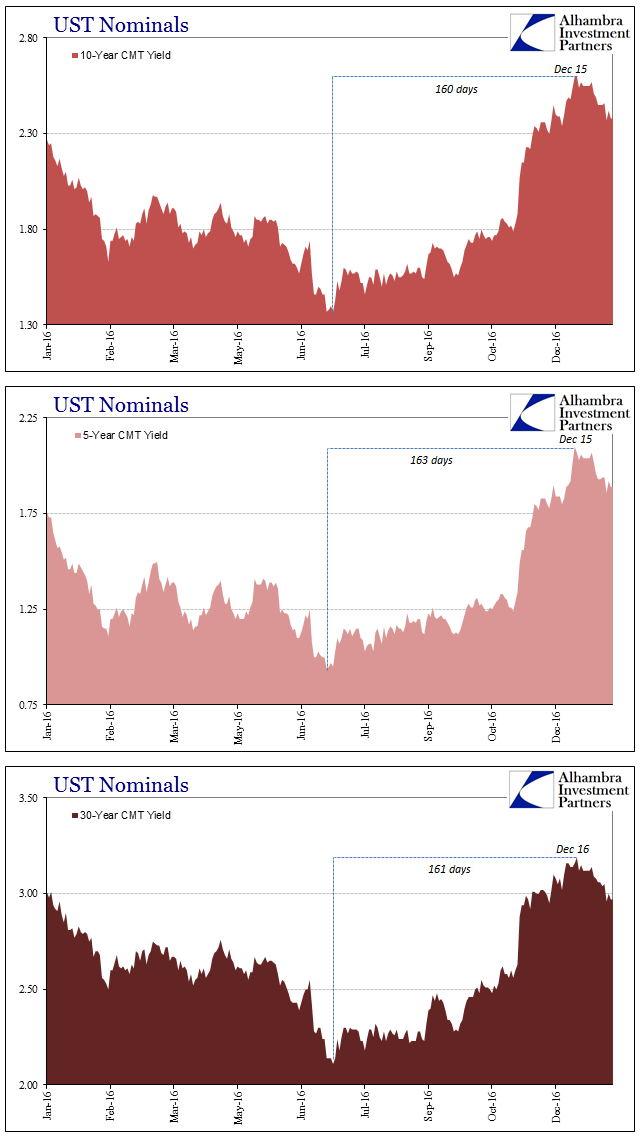
That would represent a total “reflation” to the recent “peak” of 160 days. The UST market proportions are almost exactly the same.
To make comparisons of this kind we have to make several assumptions in order for them to be meaningful and useful. The first is that the selloff in 2016 is “reflation” just as it was in 2013. If you think, to the contrary, that this time is different, that Trump’s new “stimulus” and rollback of regulations, Obamacare, and the like is sufficiently distinct so as to become actual reflation (no quotes) and chart a completely unrelated future, then none of this matters. At some point, the selloff will have to continue in everything as even a stunted “normalization” is further away than where these markets are now.
If, however, you see the similarities as more than compelling, where the “dollar” is the baseline for everything, then there is a very good probability that “reflation” is emotional and inappropriate, once again the imposition of false hope and optimism where it doesn’t belong. As to that point, that is what has latched onto my attention especially surrounding these shifts on December 15. As I wrote earlier today (subscription required):
In other words, did these markets finally awaken from “reflation” slumber to a world that really wasn’t much different than at the end of the prior year? The coincident and abrupt shift in all these prices and correlations would certainly raise the possibility. With almost a month having passed since that time, and with all these market pieces still moving, if not yet with full conviction, in the “wrong” direction it must be considered as more than a trivial one. The “reflation” of 2013, after all, lasted as a single selloff or trend only a few months.
Even gold had fallen sharply leading up to December 15, meandered sideways for a week or so after, and is now moving in the opposite direction again (safety) More significant than that or even the UST market is perhaps the change in JPY, which has appreciated since that day where by all traditional expectations it should be still doing the opposite (if interest rate or policy differentials are to be believed as the dominant setting for the exchange rate).

What ended the 2013 “reflation?” In my view, it was the combination of actually lackluster growth still that far into that year away from the 2012 slowdown, raising the prospect that the slowdown wasn’t then “transitory”, either. Combined, that possibility with the financial upset in MBS (and the massive bank capacity reassignment that followed from it) and really the currency problems overseas, the beginnings of what would become the “rising dollar”, and I think eurodollar futures investors were first to trade what was coming. The UST market ignored that only somewhat for the remainder of 2013, but eventually to start 2014 (and the non-trivial matter of a sudden wrong-way in CNY) traded the same way as eurodollar futures and never looked back no matter how many times policymakers, economists, and the media shouted about the unemployment rate and payroll figures.
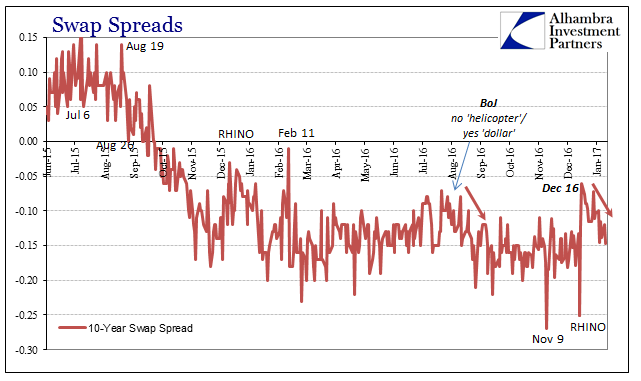
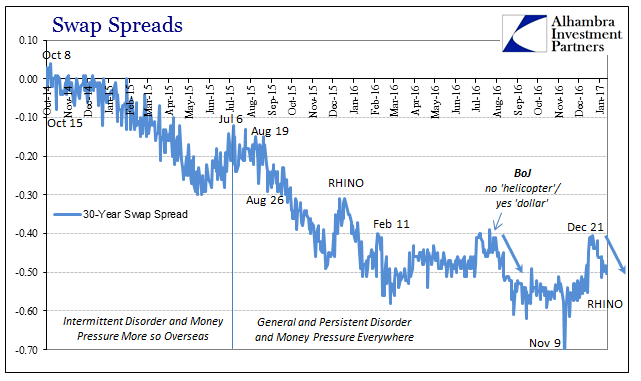
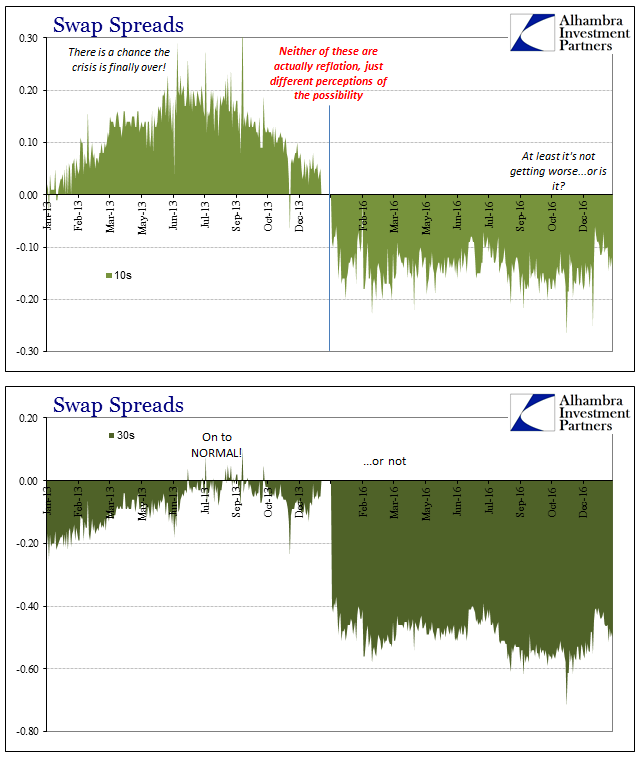
That would be, in terms of general outlook, unfortunately consistent and similar to the world as it is now. I further believe that is why the current run of “reflation” is, so far, so much more subdued than the prior one; and in some very important markets, like swaps and the related swap spreads, there was never even the slightest “reflation” to begin with. Nothing really has yet changed, except so far as the global economy and “dollar” conditions are relatively worse now than they were even at that troubled time.

As has been the case for nearly a decade, going all the way back to upsetting Bill Dudley in early 2007, eurodollar futures will very likely tell us a lot about what’s next.
Stay In Touch