
There was an extremely odd dynamic for monetary policy during the 1990’s and especially in the United States. The less Alan Greenspan said, the more markets were convinced he knew what he was doing. He purposefully said nothing, being attributed years later with developing this “fedspeak.” So long as he continued to say nothing, the more he would have to do nothing. Again, it was a very strange time.
Twenty years on, the Fed finds itself at a far different crossroads. They have finally realized that many in the public realize there is little if any value to their capacities. That applies to several parts of the institutional apparatus, but for most laypeople it is the utter incompetence of their economic models. This is a well-worn subject, where policymakers have expressed awareness of their perpetual optimism and how unsuitable it makes, and has made, their intentions. If monetary policy is as much credibility as anything, as it certainly isn’t money, then this is an enormous problem.
And so it is becoming an extremely interesting juxtaposition, where to conduct effective monetary policy two decades ago the Fed purposefully withheld detail so as to be thought perfectly capable; now it wishes to publish some greater detail in order for the public to be reassured that it didn’t really know what it is doing. Because QE failed to deliver, they want to go back and revise history to show that despite often adamant confidence in the program(s) that outcome was actually among the probabilities their models considered but were never, ever relayed publicly.
To begin correcting this reputational defect, the FOMC has voted to start including what are called fan charts with its policy materials. As is usual, if the Fed does something new you can be assured that it isn’t actually new and was in all likelihood started either in Japan or England. The Bank of England has been publishing fan charts for a very long time, though to be fair it never had a Greenspan problem.
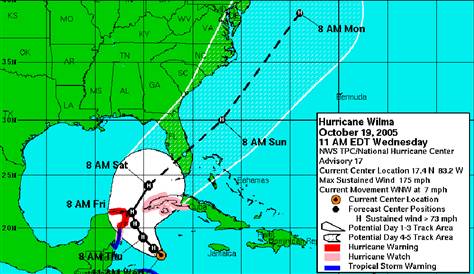
A fan chart is something like the probability cone the NOAA reports whenever there is a hurricane approaching the US. Because there is such a high degree of local variance (the weather and climate are the most representative examples of complex systems and therefore the low degree of predictability afforded to statistics to describe their various states) scientists really don’t have a good idea where any storm will go even up to a few days or even a few hours out. The best that they have been able to do is to determine the confidence interval applied to a map for where the models predict that it might end up in time and space. There are times and specific hurricanes where that interval is exceedingly large.
What the Fed has proposed is similar, to show the world that when it says the central tendency for GDP is near 3%, as it had too many times in the past decade, what it really meant was not that the Fed expected 3% GDP but that GDP could have been in some wide interval around 3%, an interval that also included some very low numbers that the economy did actually “achieve.” Officials, of course, did not want to do that then because they purposefully wanted you to believe in 3% GDP, particularly during the periods of QE. It is only long after QE has been shown to be at the very best poor policy do they now wish to retroactively describe uncertainty.
The just-released minutes from the last FOMC meeting describes the reasoning:
The revised proposal was based on further analysis and consultations following Committee discussion of a proposal at the January 2016 meeting. Participants generally supported the revised approach and agreed that fan charts would be incorporated in the SEP to be released with the minutes of the March 14–15, 2017, FOMC meeting. The Chair noted that a staff paper on measures of forecast uncertainty in the SEP, including those that would be used as the basis for fan charts in the SEP, would be made available to the public soon after the minutes of the current meeting were published, and that examples of the new charts using previously published data would be released in advance of the March meeting.
In January 2011, the Federal Reserve Bank of San Francisco published a working paper that described, using the methodology behind fan charts, just how badly the Fed’s various models had performed in anticipating the conditions, particularly hitting the mythical Zero Lower Bound (ZLB), both in occurrence and more importantly duration, that would develop and prevail in 2008 and immediately thereafter.
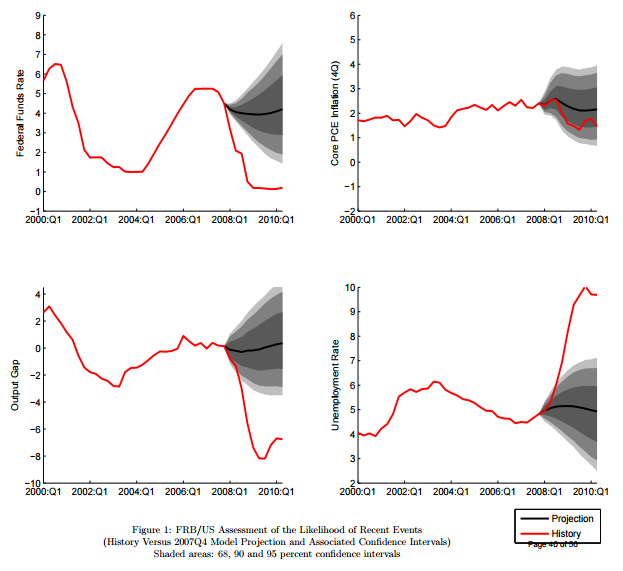
Suffice to say, all the models failed horribly (as you can see in just some of the fan charts prepared for the paper) and in all the ways in which the models were though incapable of failing. At the time, and according to the paper, the weakness of these statistical systems was in being unable to capture, like all statistical models, “tail events.” And so it was speculated that so long as models made a reasonable attempt at figuring “tail risks” that models could be better suited in the future for similar situations (that the models all uniformly described as nearly impossible).
Second, researchers need to find ways to ensure that model-generated probability distributions adequately account for relatively rare tail events, even if the data in the model’s estimation sample does not include any such events. This adjustment can be accomplished by using long samples in estimating the shock variances, or by using methods that incorporate a prior on tail events and making the distribution of these events less sensitive to recent data.
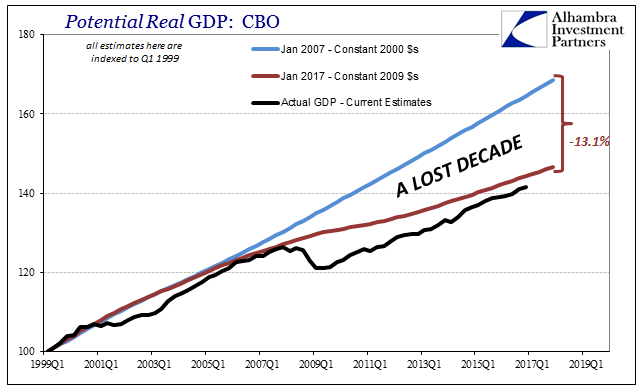
The problem with that line of thinking should be more obvious in the context of 2017 opening a second lost decade. In other words, what kind of uncertainties might actually exist where the Great “Recession” was not a single tail event but rather a full paradigm rupture?
Statistical models all assume that the near future will look like the recent past, and this 2011 paper assumed that the Fed’s models could correct that defect by looking further back in time beyond the so-called Great “Moderation” in order to capture past “tail events” within this expanded data set. However, they made that recommendation in early 2011 before the events of later 2011 that essentially killed or ended any possibility of recovery. The paper actually references, positively, the effects of QE to that point, which only demonstrates this larger weakness in econometrics and applying statistical processes to a complex system.
In particular, we find that the asset purchases undertaken by the Federal Reserve over the past two years, plus those currently underway, are roughly equivalent to a 300 basis point reduction in short-term interest rate.
If they were to have rerun these regressions for the rest of QE2 past July 2011 and then for QE3 and QE4 the results would be entirely different, meaning that the statistics still were not anywhere near capable. How would models respond to a situation where the near future (now recent past) is bears little resemblance to the recent past (now pre-crisis), meaning a clean break of one paradigm into a totally separate other? I think we know the answer to that, which is why the FOMC has voted to start publishing fan charts.
Again, it is an incredibly odd rearrangement of priorities, where the Fed wishes for us to start believing in them again because they now want to show how their models were actually less certain than you were led to believe they were; and that their predictions weren’t wrong, the economy that resulted was just in a different part of the probability “cone” or “fan” than they claimed contemporarily.
The whole thing is instead illustrative of only one thing, and it has actually little to do with accuracy, predictions, or models. The Fed in 2016, as fan charts were first brought up officially at the January 2016 FOMC meeting, finally admitted it had a credibility problem and could no longer afford, quite literally, to keep claiming QE had worked and would work. The Committee looks now to rewrite its own history so as to say that they only thought QE could have worked but overall they were uncertain about it the whole time (they swear). They just didn’t say so then, so they might as well start saying so now as if that might help correct their credibility problem.
Stay In Touch